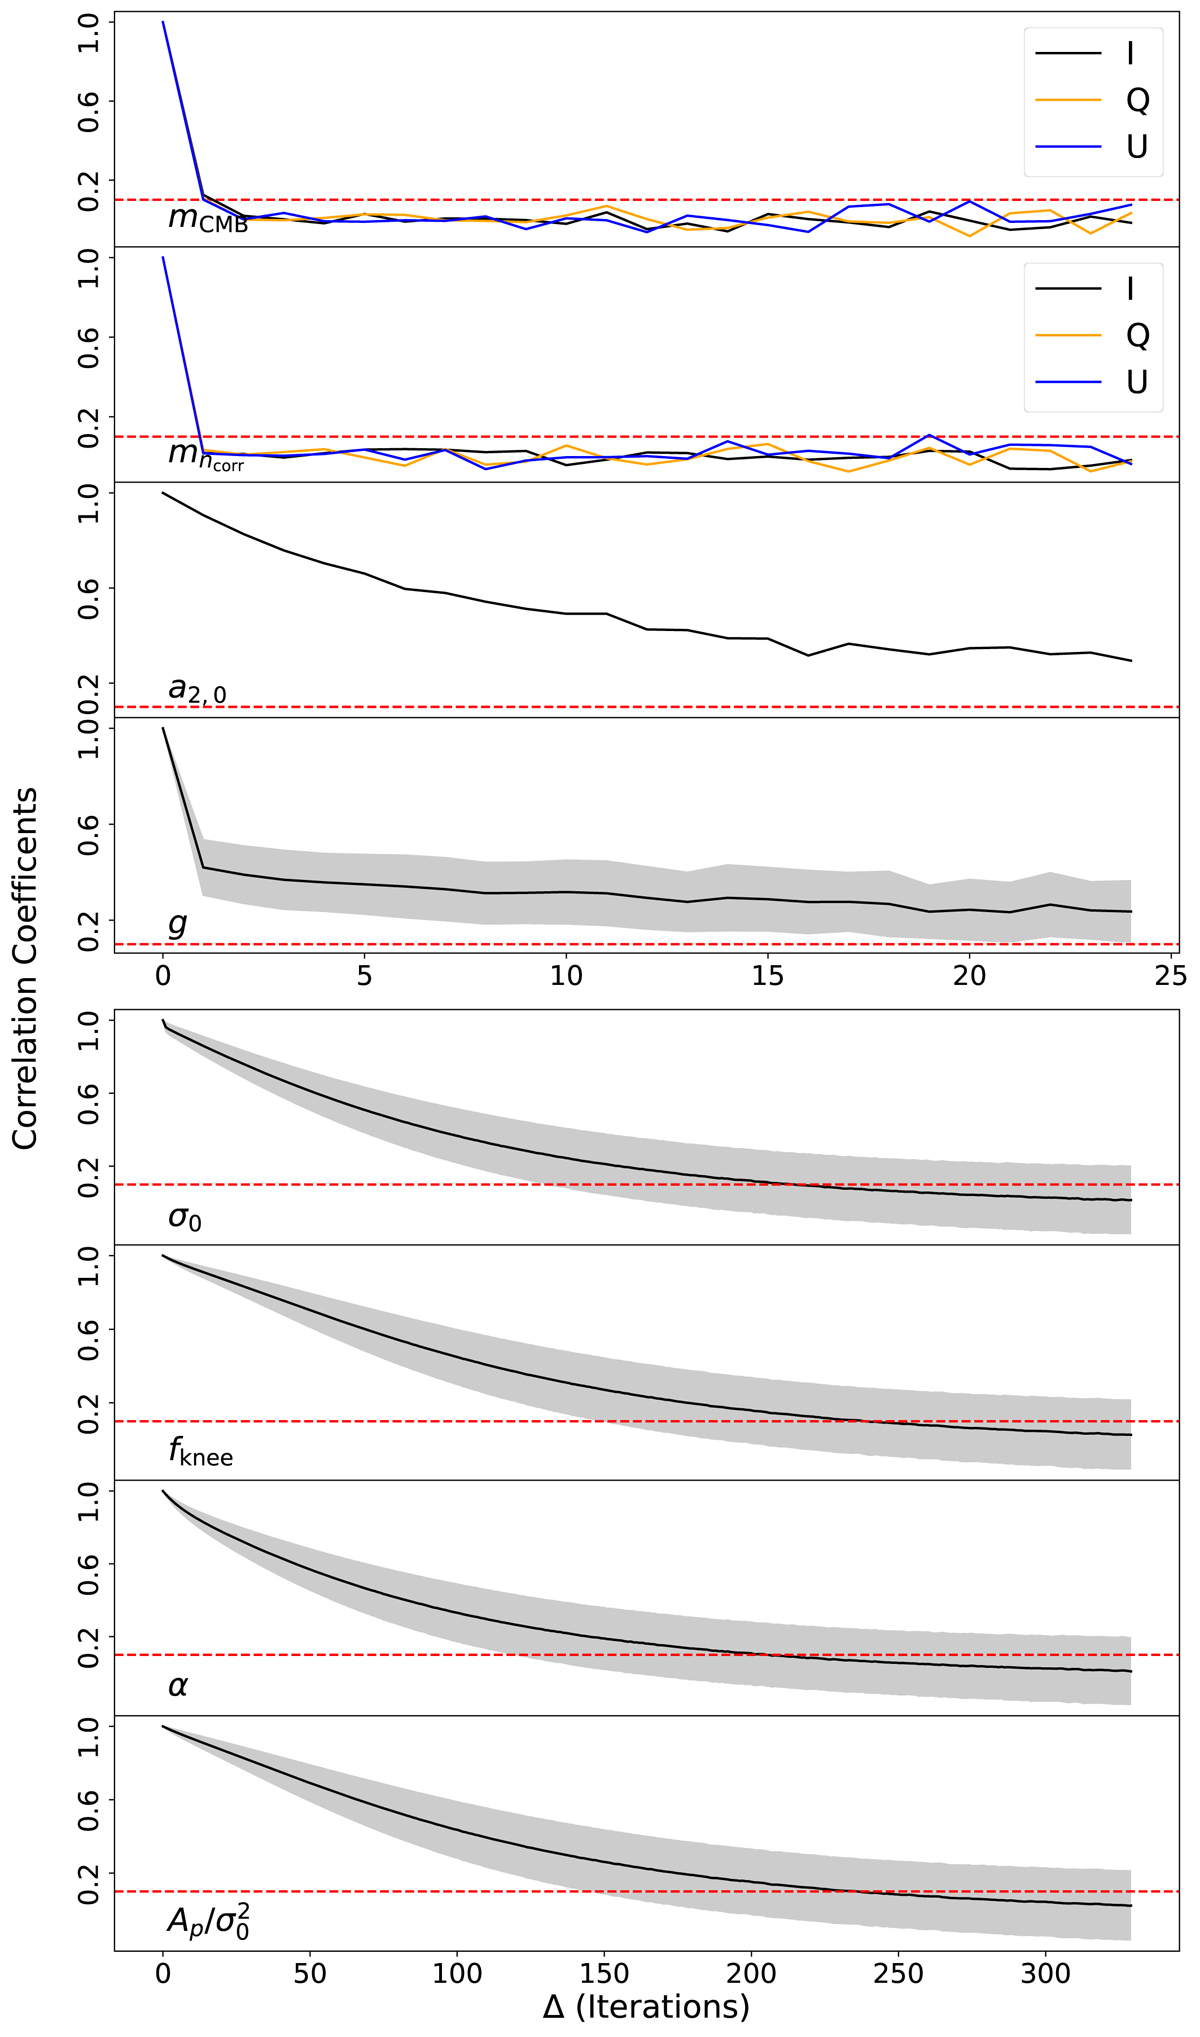
Fig. 3.
Download original image
Auto-correlation function, ρ, for selected parameters in the model, as estimated from a single chain with 10 000 samples. From top to bottom, the various panels show (1) one pixel value of the CMB component map mCMB; (2) one pixel of the correlated noise map mncorr; (3) the temperature quadrupole moment, a2, 0; (4) the PID-averaged total gain g; and (5)–(8) the PID-averaged noise PSD parameters σ0, fknee, α, and Ap/σ0. In panels with multiple lines, the various colors show Stokes T, Q, and U parameters. In panels with gray bands, the black line shows results averaged over all PIDs, and the band shows the 1σ variation among PIDs. The dashed red line marks a correlation coefficient of 0.1, which is used to define the typical correlation length of each parameter.
Current usage metrics show cumulative count of Article Views (full-text article views including HTML views, PDF and ePub downloads, according to the available data) and Abstracts Views on Vision4Press platform.
Data correspond to usage on the plateform after 2015. The current usage metrics is available 48-96 hours after online publication and is updated daily on week days.
Initial download of the metrics may take a while.