Fig. 2.
Download original image
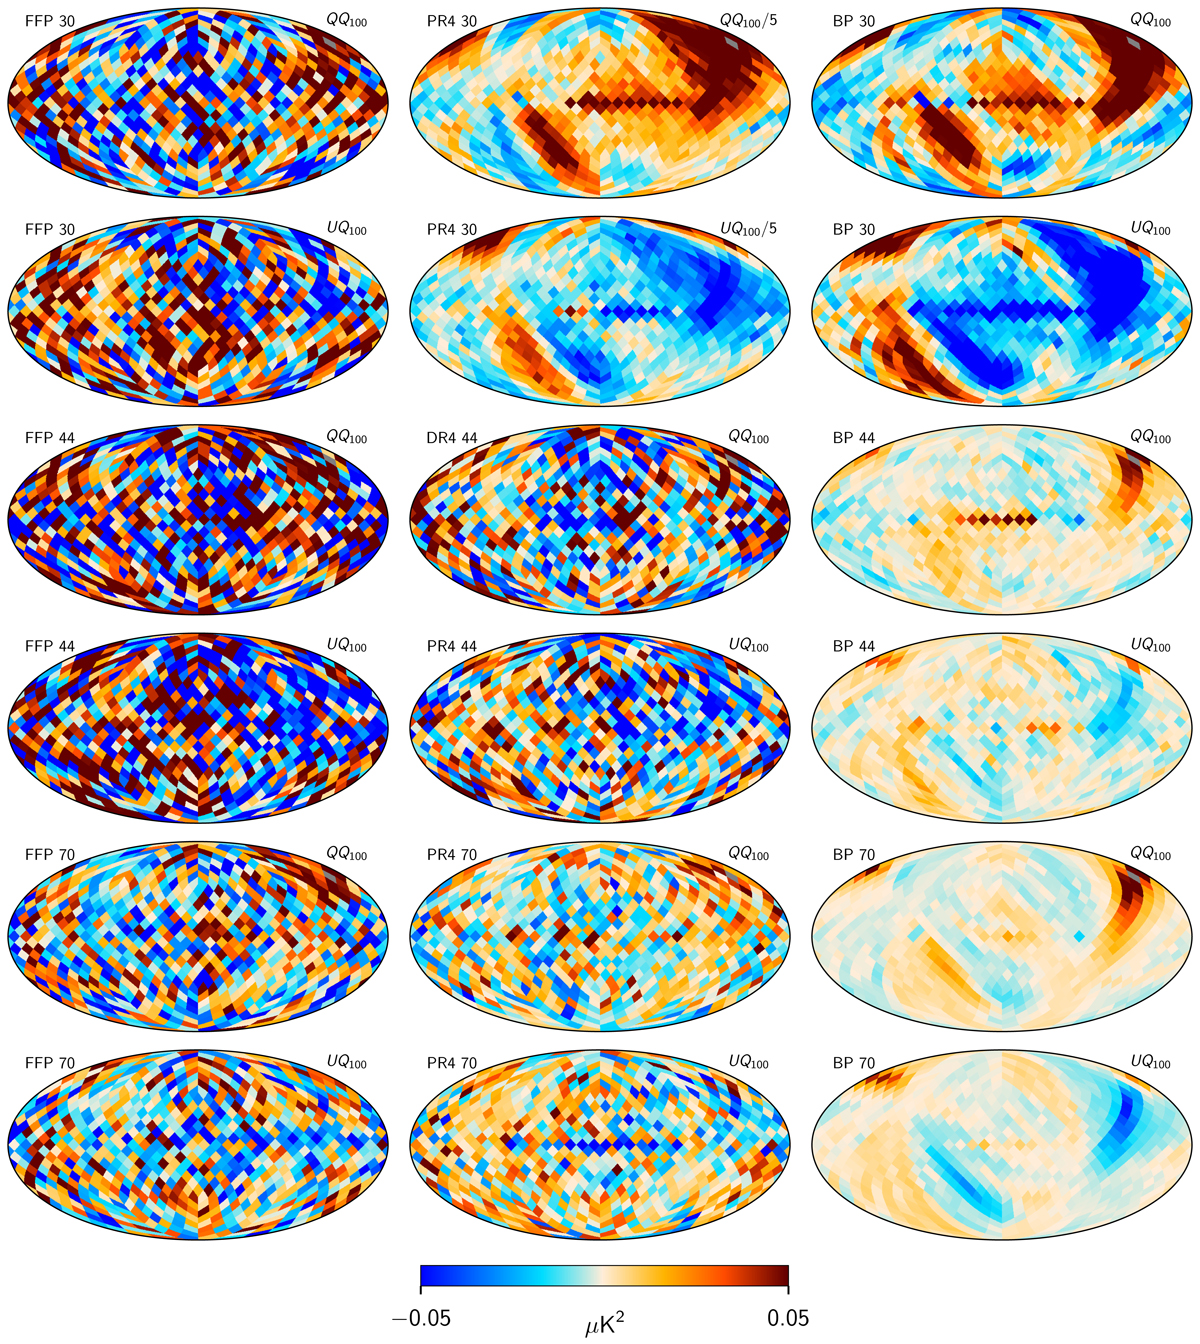
Single column of the low-resolution 30 (top section), 44 (middle section), and 70 GHz (bottom section) frequency channel covariance matrix, as estimated from 300 LFI DPC FFP10 frequentist simulations (left column); from 300 PR4 prior simulations (middle column); and from 3200 BEYONDPLANCK posterior simulations (right column). The selected column corresponds to the Stokes Q pixel number 100 marked in gray, which is located in the top right quadrant. All covariance matrices are constructed at Nside = 8. Note: the Planck PR4 30 GHz covariance slice has been divided by a factor of 5 and thus it is even stronger than the color scale naively implies.
Current usage metrics show cumulative count of Article Views (full-text article views including HTML views, PDF and ePub downloads, according to the available data) and Abstracts Views on Vision4Press platform.
Data correspond to usage on the plateform after 2015. The current usage metrics is available 48-96 hours after online publication and is updated daily on week days.
Initial download of the metrics may take a while.