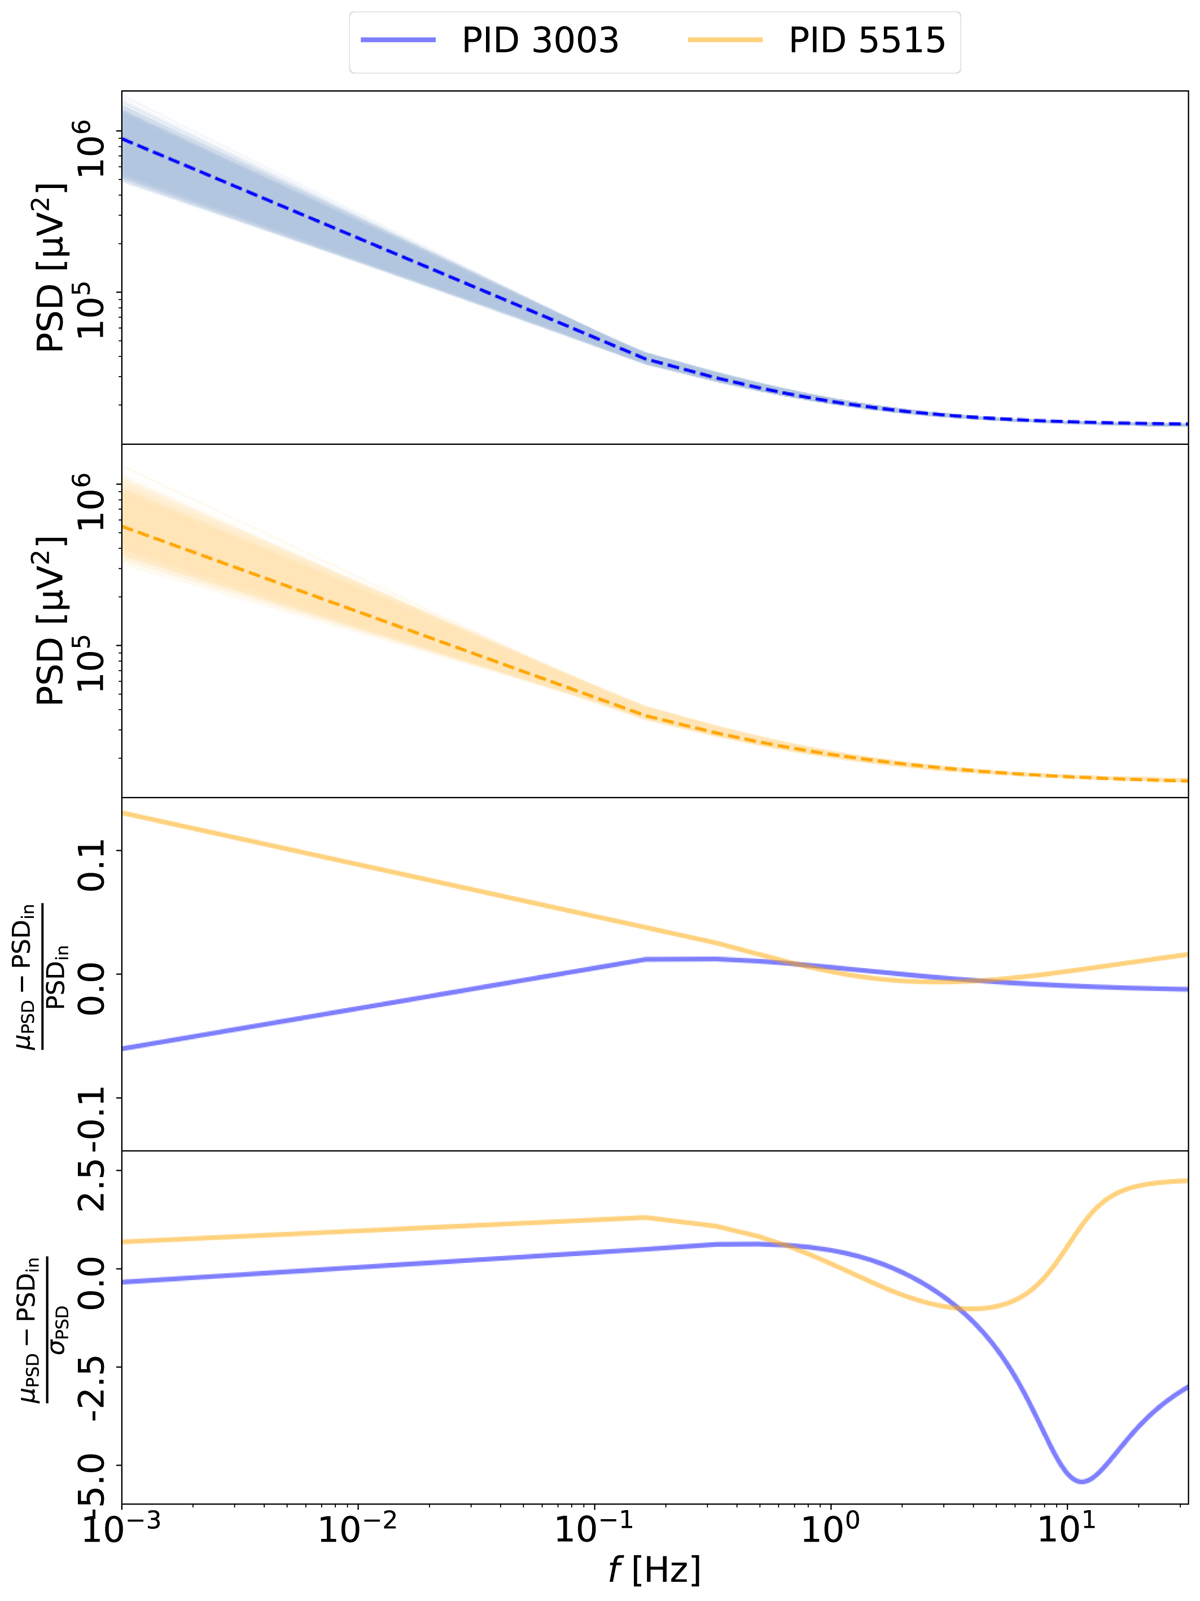
Fig. 15.
Download original image
Comparison of recovered correlated noise PSD in terms of the functional form, Pn(f). The top two panels show results for the same PIDs as in Fig. 4. Faint lines indicate individual Gibbs samples, while the dashed lines show the true input functions. The bottom two panels show the difference between the posterior mean function and the true input as a fraction of the latter and in units of the posterior rms, respectively.
Current usage metrics show cumulative count of Article Views (full-text article views including HTML views, PDF and ePub downloads, according to the available data) and Abstracts Views on Vision4Press platform.
Data correspond to usage on the plateform after 2015. The current usage metrics is available 48-96 hours after online publication and is updated daily on week days.
Initial download of the metrics may take a while.