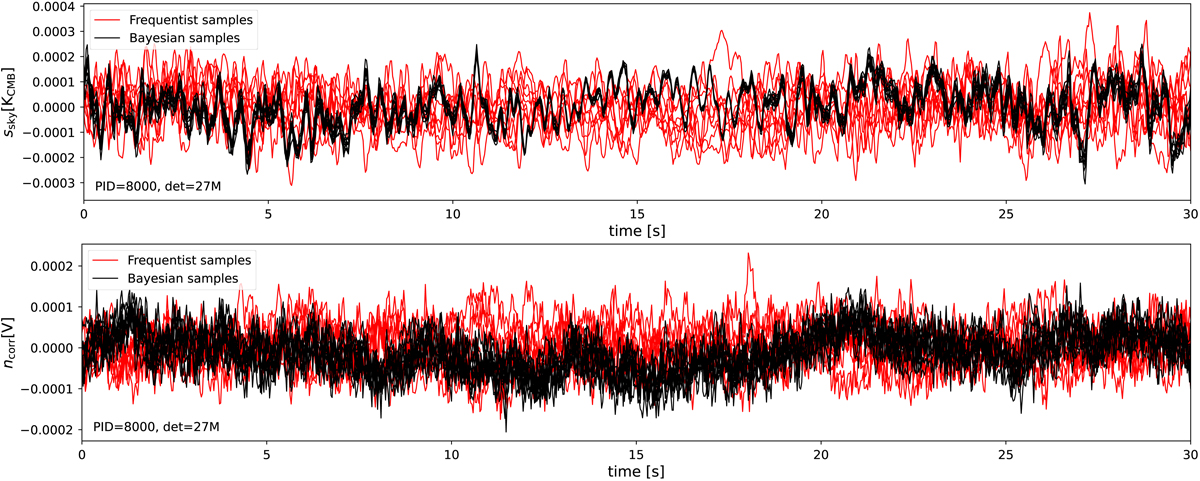
Fig. 1.
Download original image
Comparison of ten prior (red) and ten posterior (black) simulations in time-domain. Each line represents one independent realization of the respective type. The top panel shows sky model (i.e., CMB) simulations and the bottom panel shows correlated noise simulations.
Current usage metrics show cumulative count of Article Views (full-text article views including HTML views, PDF and ePub downloads, according to the available data) and Abstracts Views on Vision4Press platform.
Data correspond to usage on the plateform after 2015. The current usage metrics is available 48-96 hours after online publication and is updated daily on week days.
Initial download of the metrics may take a while.