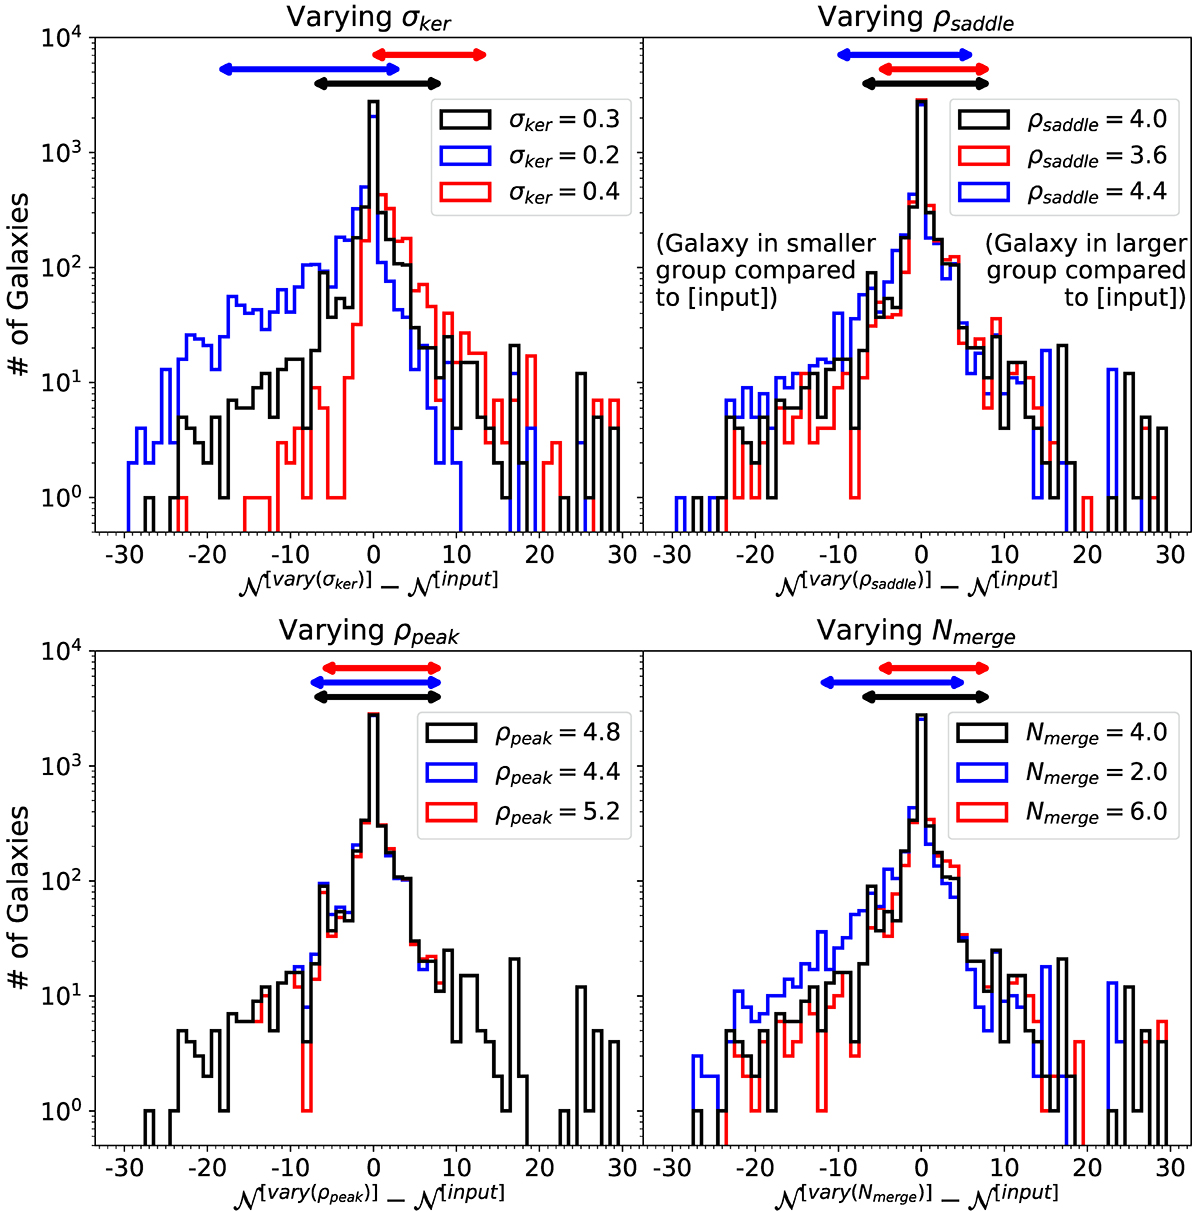
Fig. 4.
Download original image
Histograms illustrating how the group membership depends on the free parameters of TD-ENCLOSER. In each panel, three histograms are shown each corresponding to a particular set of parameter values. In each case, all but one of the values are set to the default. The parameter which is varied is indicated in the legend. The black histogram is the same in all panels, as this corresponds to the default values for all the parameters. In each panel, the x-axis is the difference between the richness of the group a particular galaxy belongs to in the recovered distribution using the chosen value for each parameter, and the richness of the group that the galaxy belongs to in the input catalogue. Finally, we indicate the inner 95% of each distribution with arrows coloured according to the corresponding histogram.
Current usage metrics show cumulative count of Article Views (full-text article views including HTML views, PDF and ePub downloads, according to the available data) and Abstracts Views on Vision4Press platform.
Data correspond to usage on the plateform after 2015. The current usage metrics is available 48-96 hours after online publication and is updated daily on week days.
Initial download of the metrics may take a while.