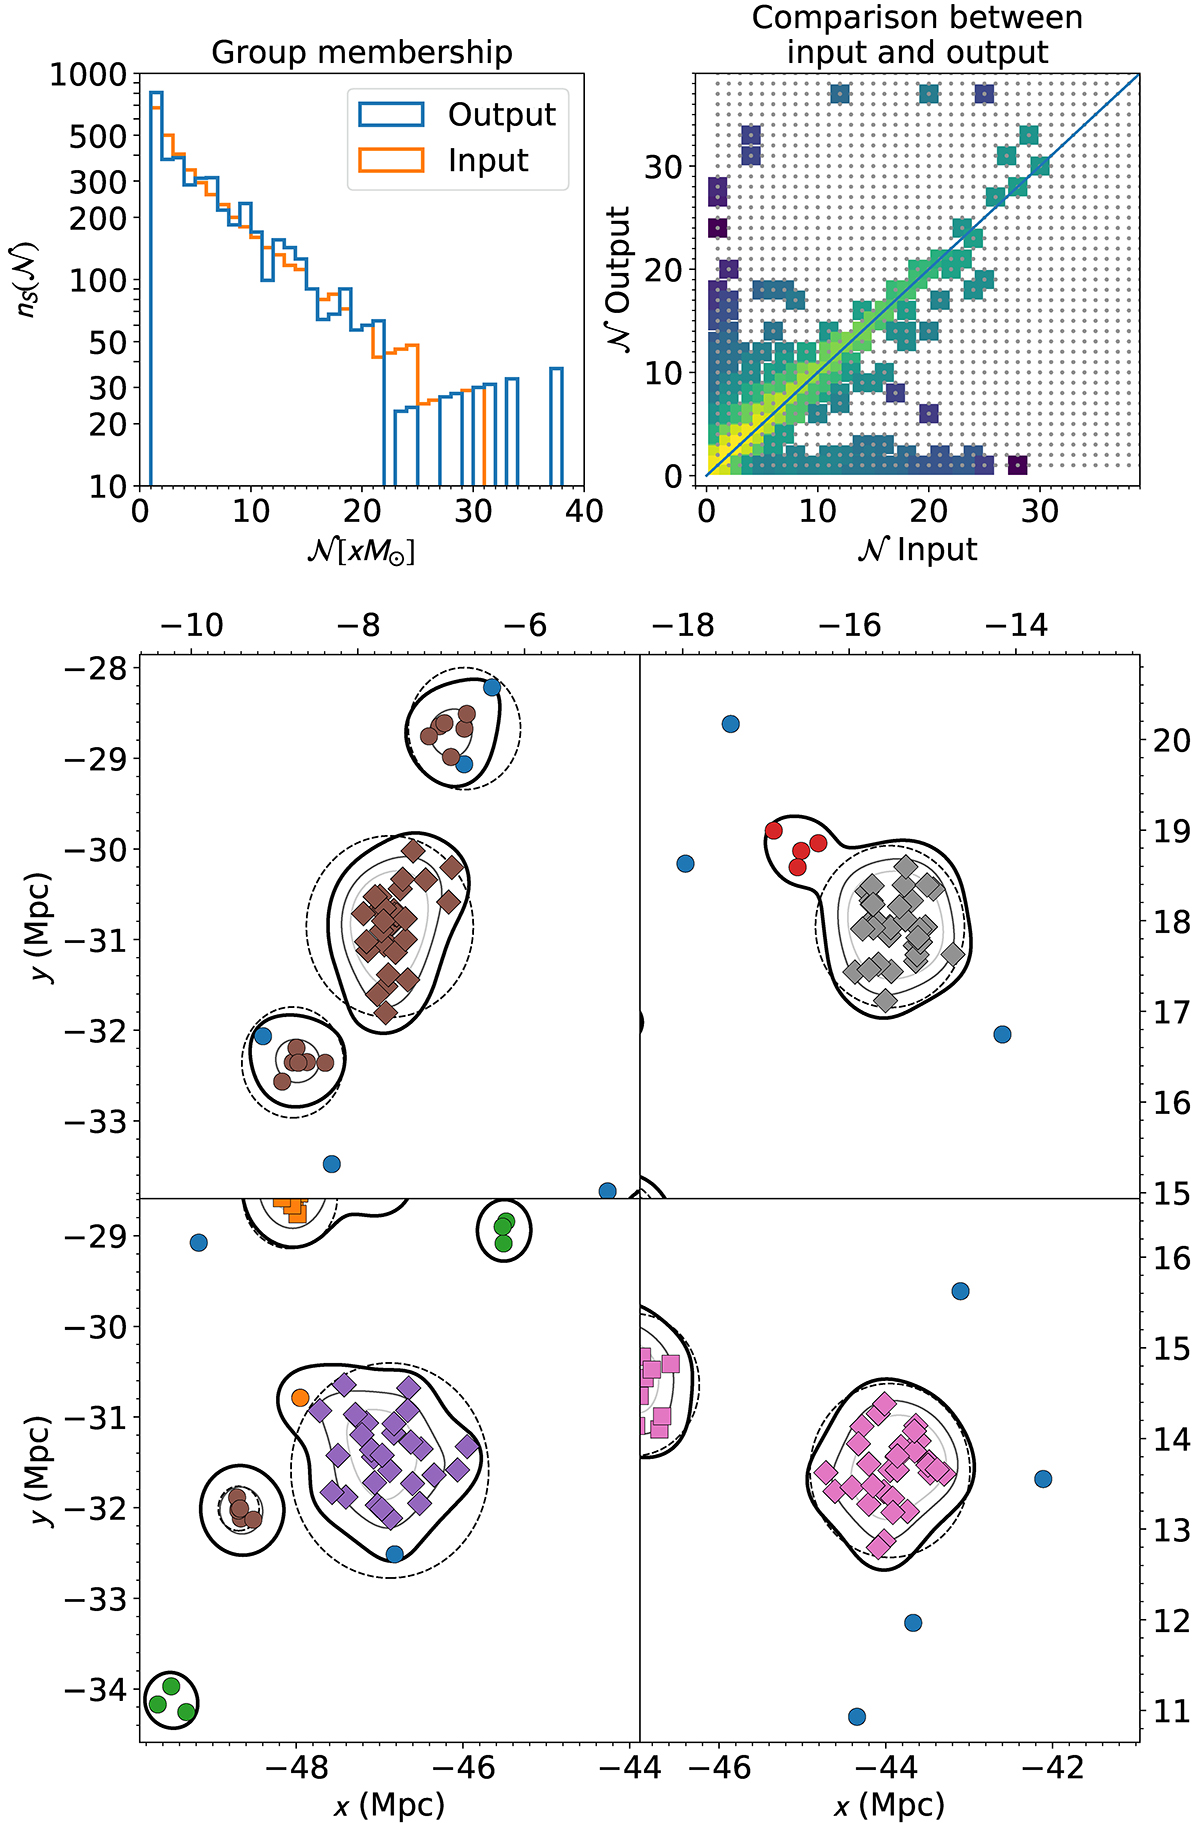
Fig. 3.
Download original image
Top left: mass function of the mock catalogue (described by a Schechter function) is shown in orange and the mass function of the groups found by TD-ENCLOSER is shown in blue. Top right: galaxy-wise comparison of the richness of their enclosing groups between the input and output catalogues. The colour in each cell represents the number of galaxies in that cell, where yellow or purple indicates a larger or smaller number respectively. Bottom: same as the bottom panel of Fig. 2, except that galaxies are coloured according to the groups which they have been assigned by TD-ENCLOSER. The contours are ρouter (black), 2.5ρouter = ρsaddle (dark grey) and 4ρouter (light grey). Isolated galaxies are shown as blue circles and galaxy pairs are shown as orange circles. The colours continue in sequence and the marker indicates the group size in multiples of 10: circles are between 1 and 10, squares are between 11 and 20, diamonds are between 21 and 30 and triangles are between 31 and 40.
Current usage metrics show cumulative count of Article Views (full-text article views including HTML views, PDF and ePub downloads, according to the available data) and Abstracts Views on Vision4Press platform.
Data correspond to usage on the plateform after 2015. The current usage metrics is available 48-96 hours after online publication and is updated daily on week days.
Initial download of the metrics may take a while.