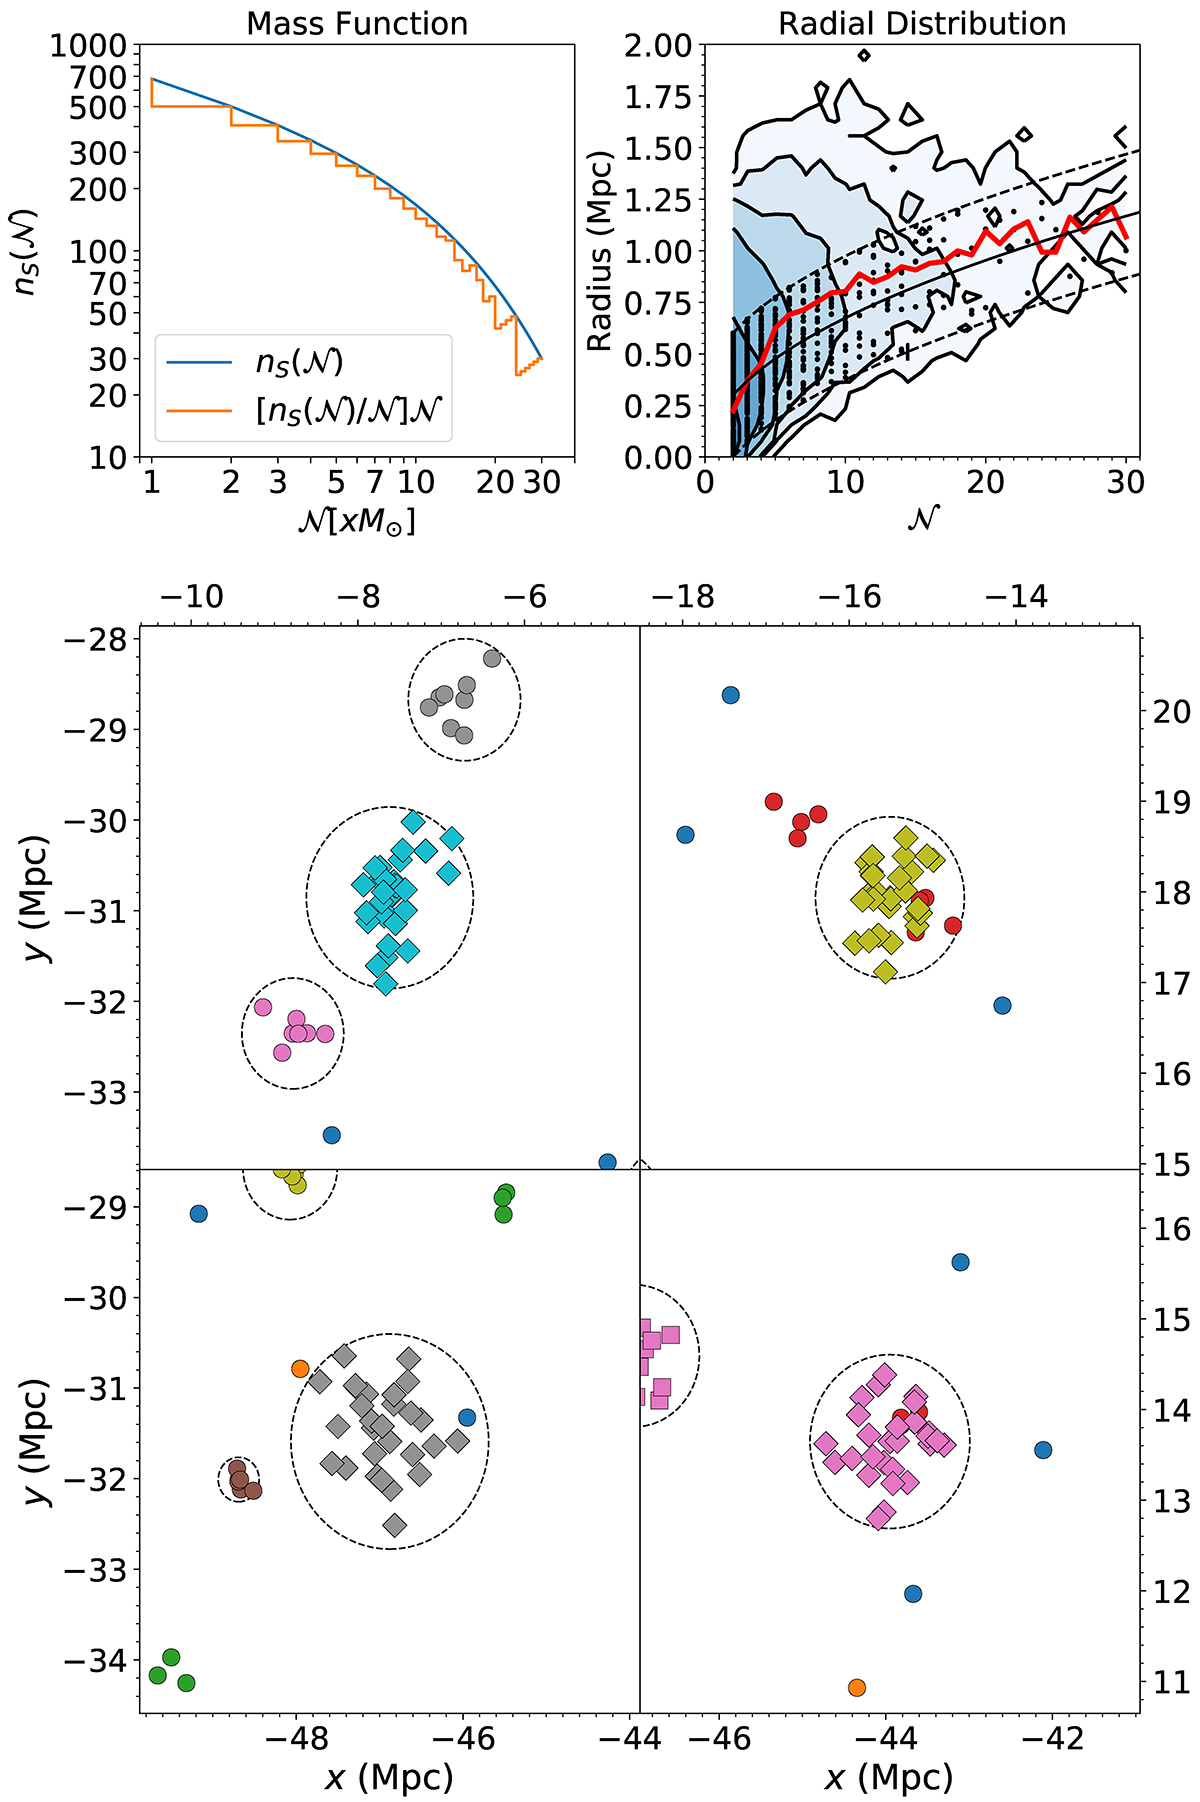
Fig. 2.
Download original image
Top left: mass function which defines our mock catalogue. The blue curve is Eq. (2) and the orange curve is the final mass distribution. At each value of 𝒩, the orange curve is the number of galaxies contained within the maximum integer number of groups with size 𝒩 allowed by the blue curve (see text). Top right: radial size of groups as a function of group membership. The black points are the mock galaxies and are bound by the dashed black lines. The value of the black solid line at 𝒩 = 2 is equal to σker: only pairs where the two galaxies are closer than about this value are grouped as pairs by TD-ENCLOSER (at 𝒩 = 2). We overlay 88357 groups with richness between 2 and 30 members from the Tempel et al. (2017) catalogue as a blue contour map. The median group radius for each group richness for the Tempel et al. (2017) catalogue is shown in red. Bottom: we show the four largest groups in the mock catalogue. Around each group of five or more members, the maximum radius is shown as a dashed circle. Each group is identified by a colour and marker.
Current usage metrics show cumulative count of Article Views (full-text article views including HTML views, PDF and ePub downloads, according to the available data) and Abstracts Views on Vision4Press platform.
Data correspond to usage on the plateform after 2015. The current usage metrics is available 48-96 hours after online publication and is updated daily on week days.
Initial download of the metrics may take a while.