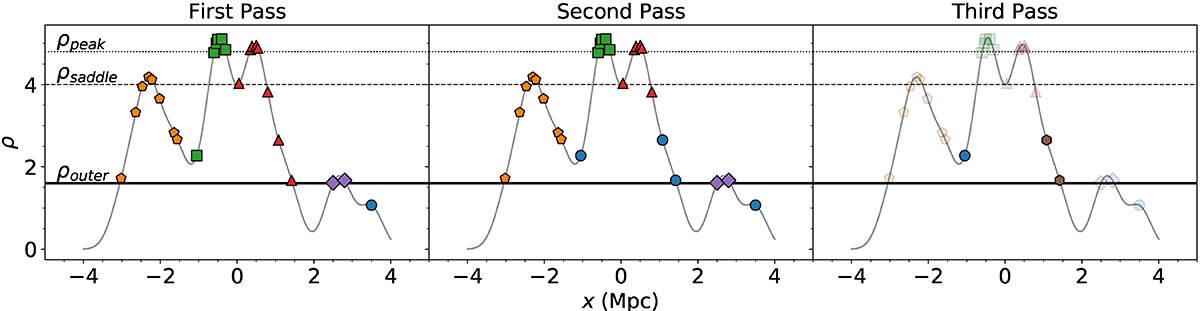
Fig. 1.
Download original image
One-dimensional visualisation of the group finder algorithm TD-ENCLOSER introduced in this section. The points in the three panels are identical and each point represents a galaxy. Galaxies belonging to the same group as coloured accordingly. The contour levels from bottom up are ρouter (solid), ρsaddle (dashed) and ρpeak (dotted). The outcome of the first pass is shown in the first panel, where galaxies are assigned to groups based only on the contour morphology, shown as the grey curve. In the second pass, outliers are disconnected from their groups based on the density of their Nmerge − 1 neighbours and are tagged as isolated. In the third pass, each ejected galaxy is assigned to a new group. All galaxies which were not clipped in the second pass are shown as faint to indicate that they are considered to be absent in the third pass.
Current usage metrics show cumulative count of Article Views (full-text article views including HTML views, PDF and ePub downloads, according to the available data) and Abstracts Views on Vision4Press platform.
Data correspond to usage on the plateform after 2015. The current usage metrics is available 48-96 hours after online publication and is updated daily on week days.
Initial download of the metrics may take a while.