Fig. 2.
Download original image
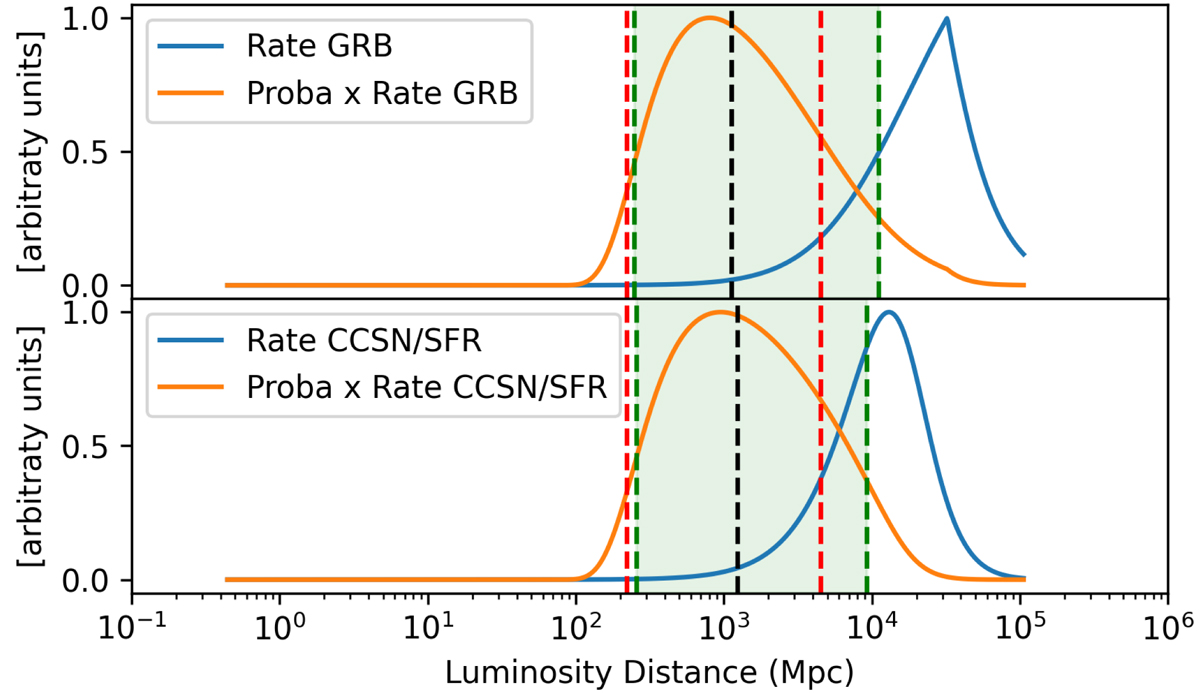
Transient rates as a function of luminosity distance for CCSN and GRB populations and their convolution with ![]() for a given value of
for a given value of ![]() (here 1055 erg for illustration purposes). The black dashed line indicate the median distance in each case, and the green band marks the 5%–95% percentiles, namely, the 90% probable distance of the source. The red dashed lines represent the 5%–95% percentiles in the case of a transient rate with no redshift evolution.
(here 1055 erg for illustration purposes). The black dashed line indicate the median distance in each case, and the green band marks the 5%–95% percentiles, namely, the 90% probable distance of the source. The red dashed lines represent the 5%–95% percentiles in the case of a transient rate with no redshift evolution.
Current usage metrics show cumulative count of Article Views (full-text article views including HTML views, PDF and ePub downloads, according to the available data) and Abstracts Views on Vision4Press platform.
Data correspond to usage on the plateform after 2015. The current usage metrics is available 48-96 hours after online publication and is updated daily on week days.
Initial download of the metrics may take a while.