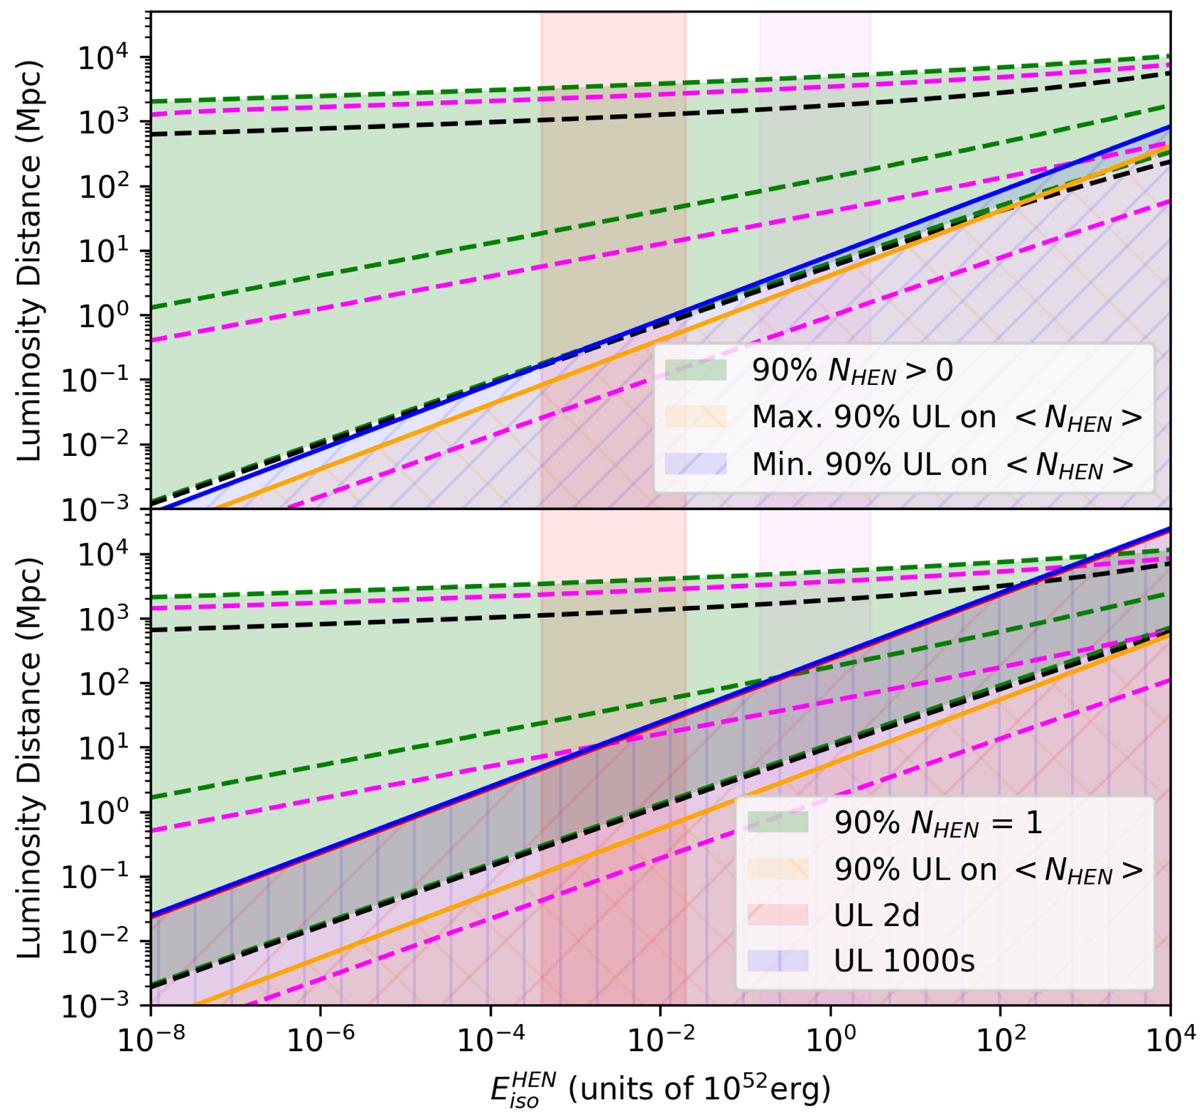
Fig. 1.
Download original image
Distance of a source vs its isotropic HEN energy plan showing the probable 90% interval for the source distance, for different populations and spectral indices. Top: after the first notice, when the number of observed HEN event is 1, for a CCSN/SFR population assuming a spectral index γ = 2, in green. The yellow and blue region shows the region excluded after the first notice, given the minimum and maximum upper limits on the average number of HEN events. Bottom: Same quantities after the second notice reporting the search of additional HEN events and fluence limits in two different time windows (1000s and 2 days). In this plot, the limits are the ones given for the event ICECUBE-230306A. The colored vertical bands show typical maximum energies for different classes of possible sources. The green dashed line indicate the median distances. The magenta lines show the modified 5%–95% interval for a GRB-population together with γ = 2.5, whereas the black lines refer to a population with no redshift evolution and γ = 2.
Current usage metrics show cumulative count of Article Views (full-text article views including HTML views, PDF and ePub downloads, according to the available data) and Abstracts Views on Vision4Press platform.
Data correspond to usage on the plateform after 2015. The current usage metrics is available 48-96 hours after online publication and is updated daily on week days.
Initial download of the metrics may take a while.