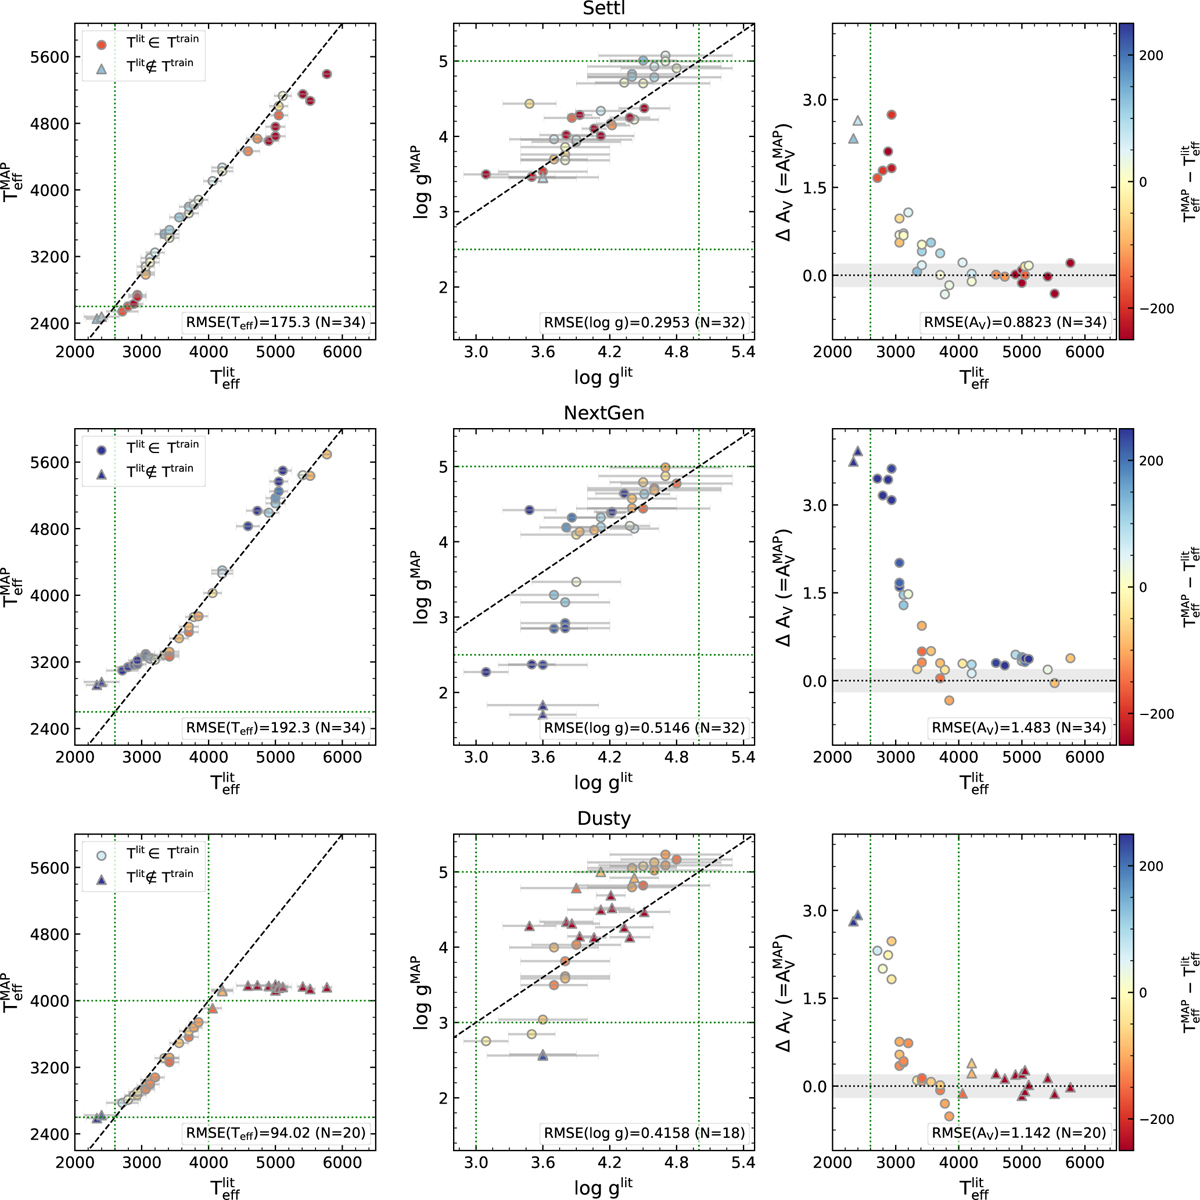
Fig. 2
Download original image
Comparison of MAP predictions with literature values in Table 1. Stars are basically denoted by circles, but triangles denote stars that were excluded in analyses such as RMSE calculation either because their literature temperature values exceed the cINN training range or because their literature surface gravity values are lacking. The colour indicates the temperature deviation between the MAP estimate and the literature value. We indicate the training range of each parameter with dotted green lines. In the third column, the horizontal grey area presents the 1σ uncertainty (i.e. 0.2 mag) of extinction provided by the literature.
Current usage metrics show cumulative count of Article Views (full-text article views including HTML views, PDF and ePub downloads, according to the available data) and Abstracts Views on Vision4Press platform.
Data correspond to usage on the plateform after 2015. The current usage metrics is available 48-96 hours after online publication and is updated daily on week days.
Initial download of the metrics may take a while.