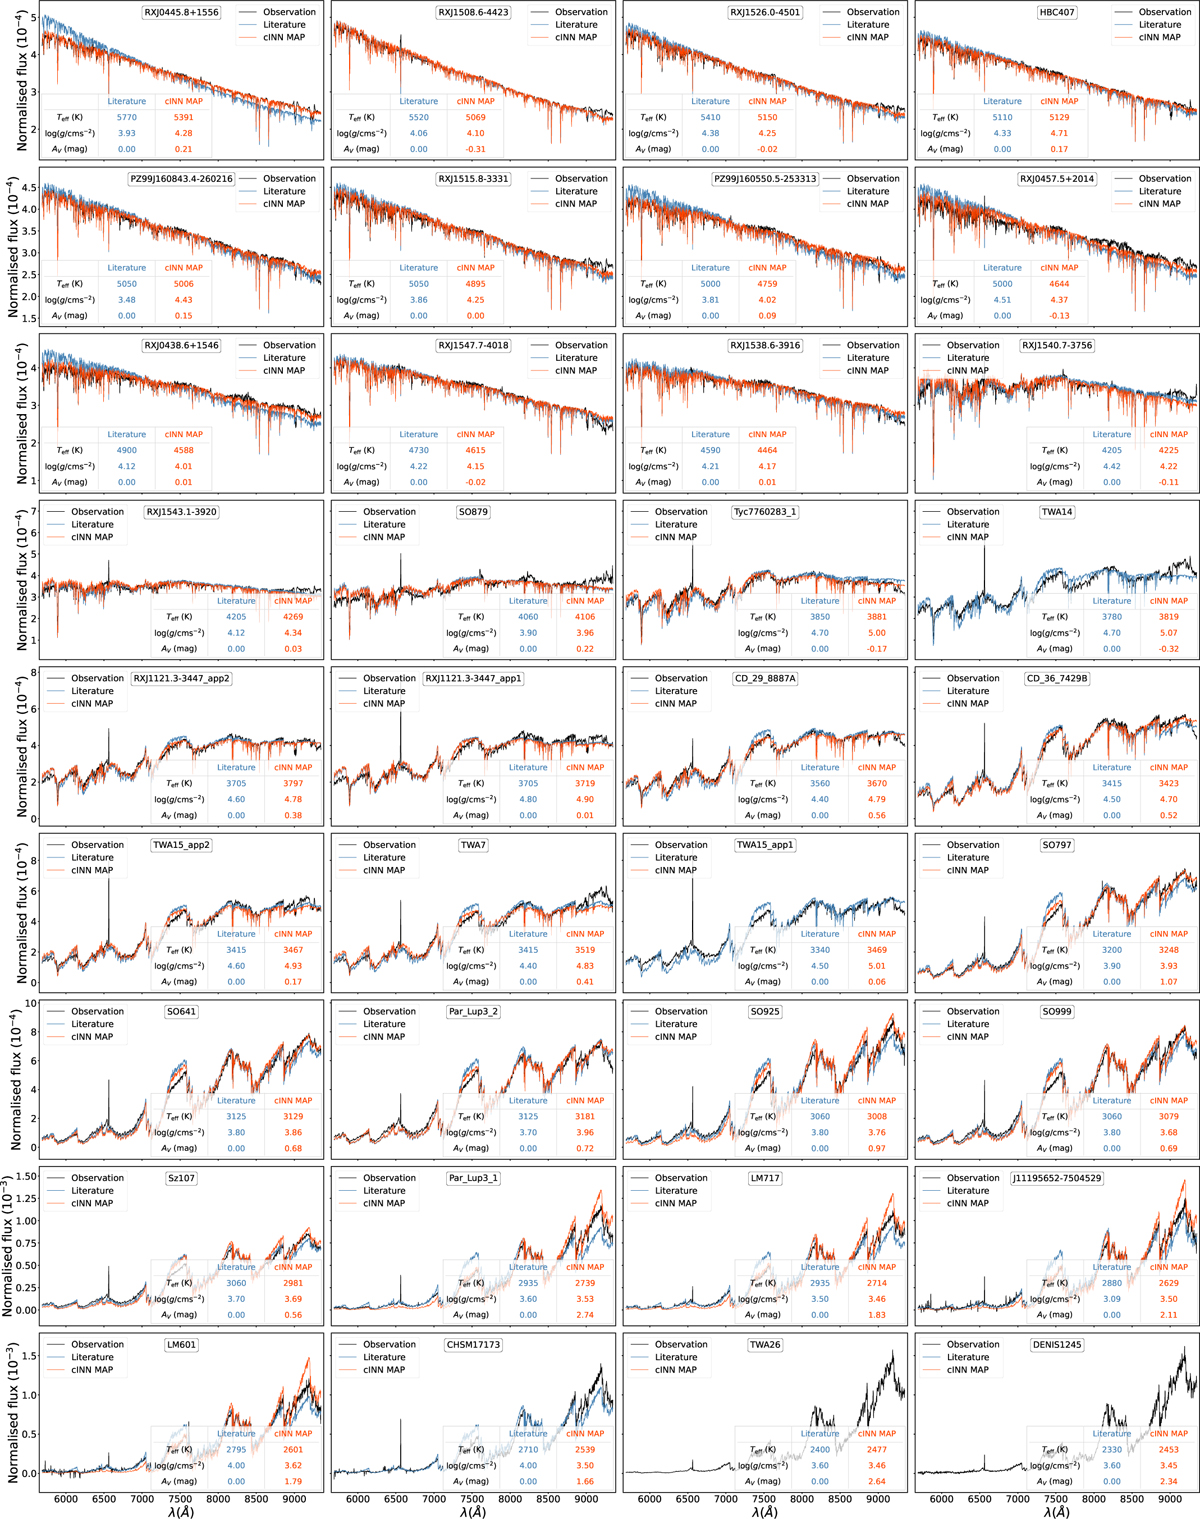
Fig. A.6
Download original image
Resimulation results for all class III templates for the cINN trained on the Settl library. In each panel, the black curve indicates the observed spectrum, and the red and blue curves correspond to the spectra that were resimulated based on the cINN MAP estimates and literature properties, respectively. The latter values are summarised in the table in each panel. If either the red or blue or both curves are lacking, the corresponding set of parameters could not be resimulated. For the RMSEs and R2 scores of the resimulated spectra, see Table A.1.
Current usage metrics show cumulative count of Article Views (full-text article views including HTML views, PDF and ePub downloads, according to the available data) and Abstracts Views on Vision4Press platform.
Data correspond to usage on the plateform after 2015. The current usage metrics is available 48-96 hours after online publication and is updated daily on week days.
Initial download of the metrics may take a while.