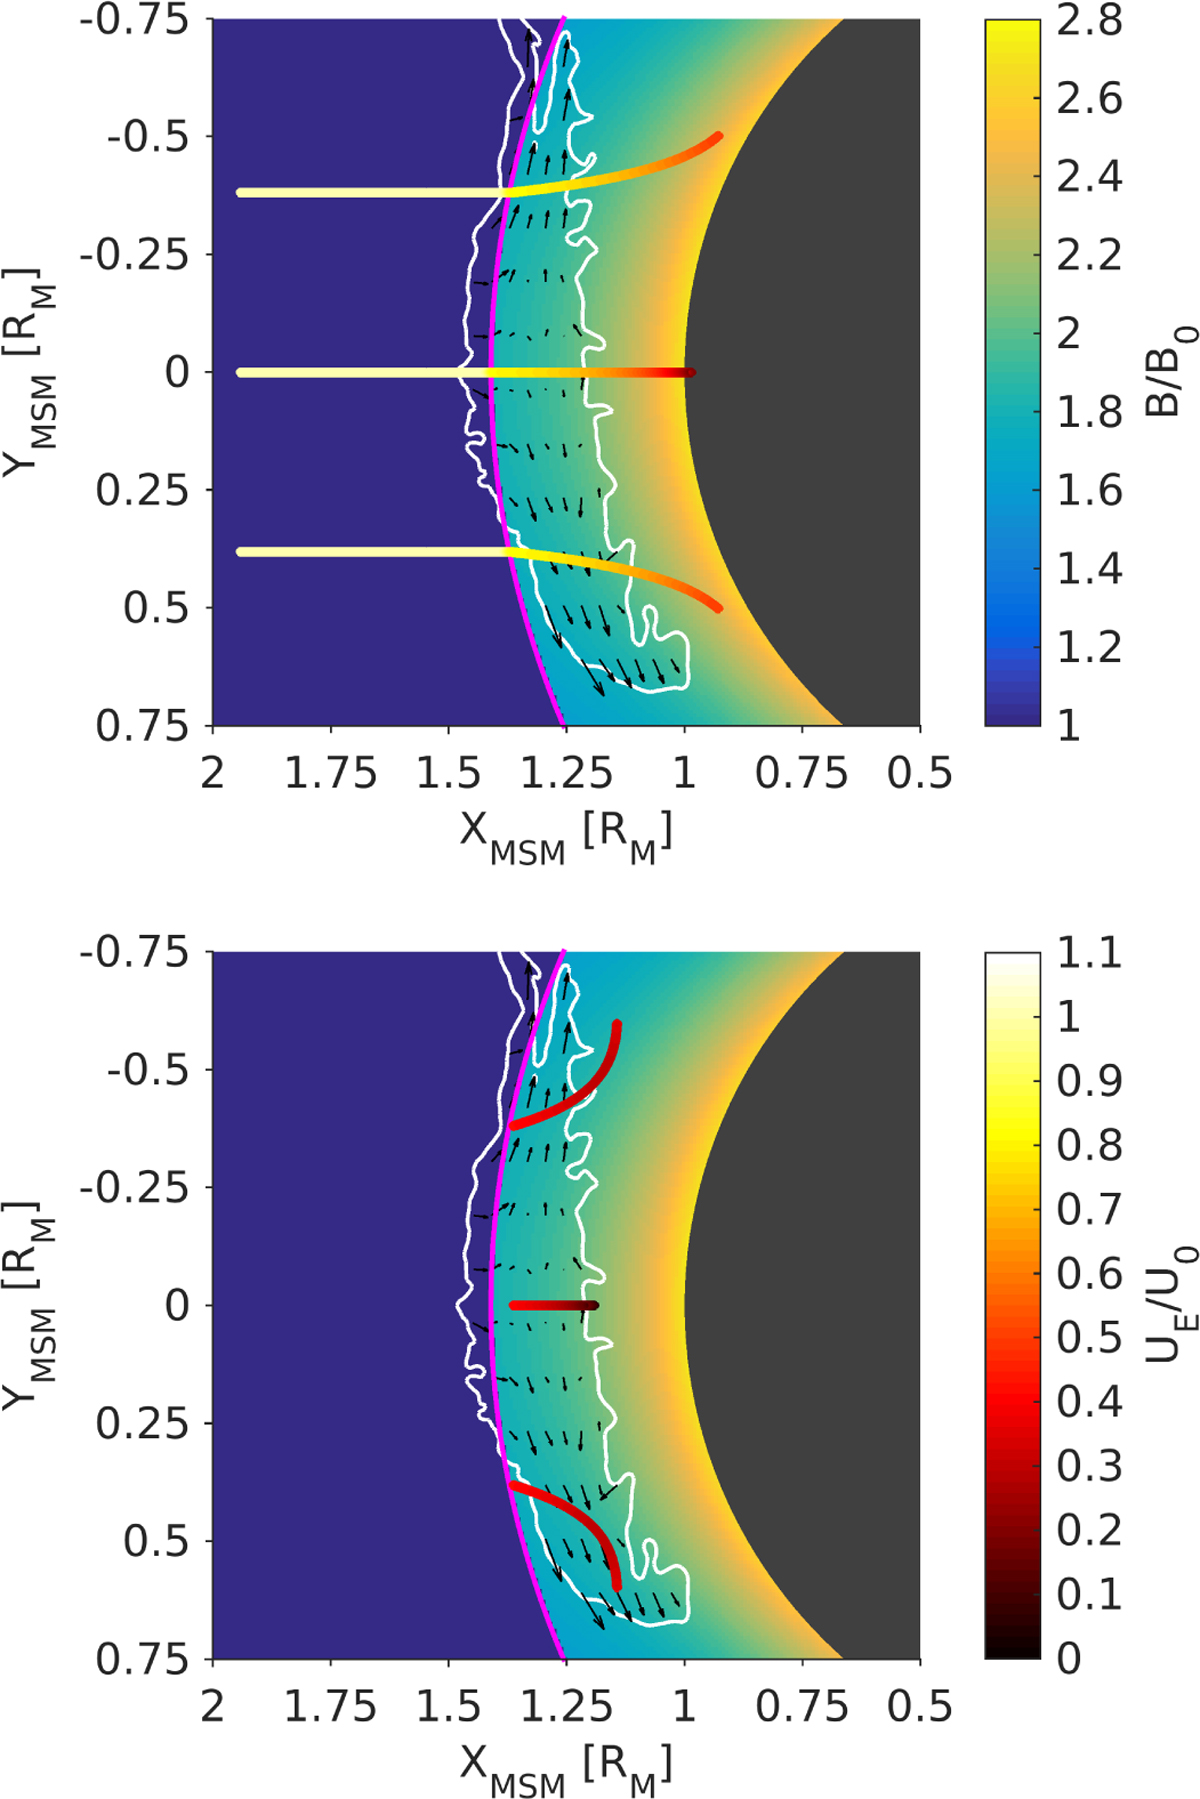
Fig. 7
Download original image
Three characteristic curves of Eq. (2) traced in the equatorial plane (ZMSM = 0). The initial conditions correspond to the central region of the plasma element and its lateral edges. The curves are color coded with the magnitude of the zero-order drift velocity that satisfies Eq. (2) and superposed onto the PIC solution illustrated in the bottom-left panel of Fig. 5. The characteristic curves are computed for two different classes of initial conditions: upstream (top) and downstream (bottom) the magnetopause.
Current usage metrics show cumulative count of Article Views (full-text article views including HTML views, PDF and ePub downloads, according to the available data) and Abstracts Views on Vision4Press platform.
Data correspond to usage on the plateform after 2015. The current usage metrics is available 48-96 hours after online publication and is updated daily on week days.
Initial download of the metrics may take a while.