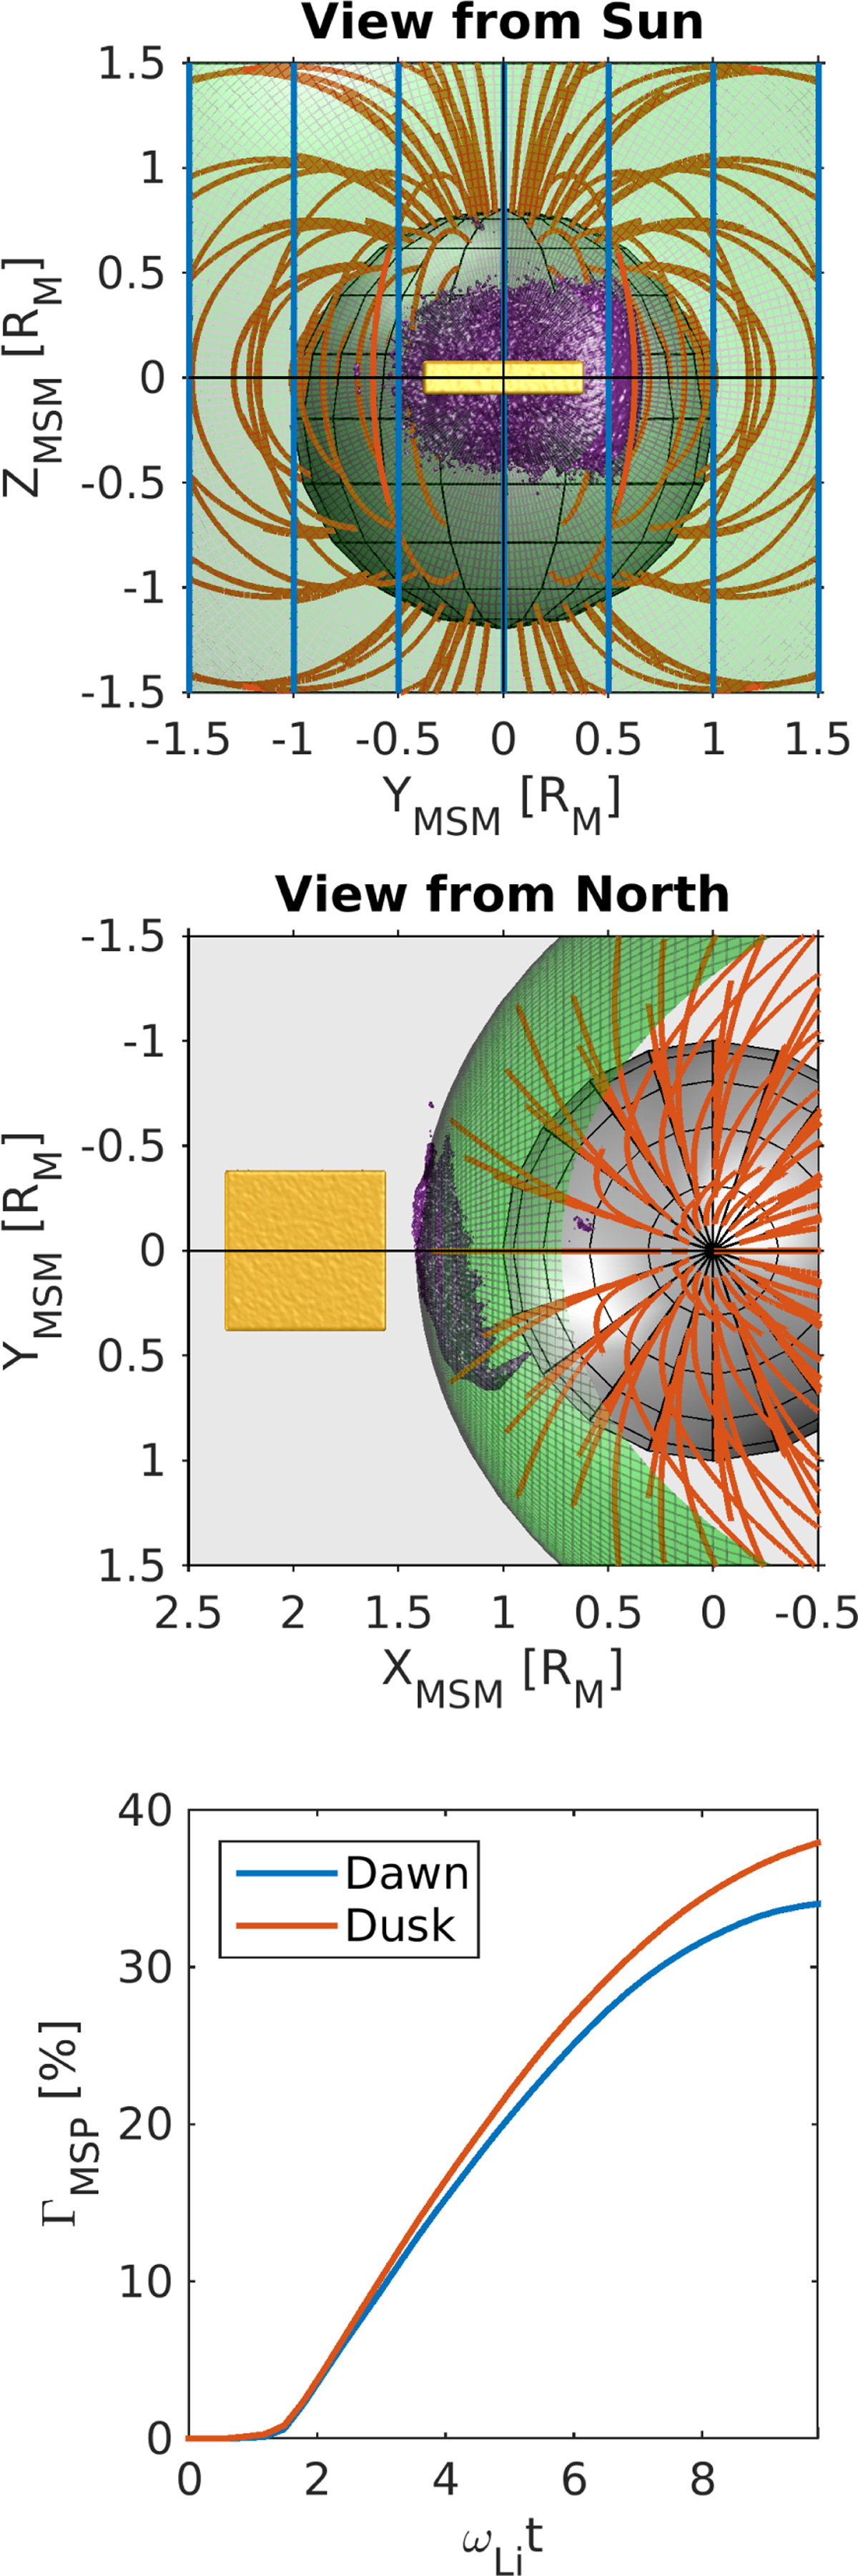
Fig. 6
Download original image
Views of the simulation domain from the Sun (top) and above the north pole (middle) for case A. We show the ion density isosurface at initialization (yellow) and at the end of run (purple). The magneto-spheric penetration degree variation from initialization to the end of run for the dawn (blue curve) and dusk (red curve) flanks (bottom).
Current usage metrics show cumulative count of Article Views (full-text article views including HTML views, PDF and ePub downloads, according to the available data) and Abstracts Views on Vision4Press platform.
Data correspond to usage on the plateform after 2015. The current usage metrics is available 48-96 hours after online publication and is updated daily on week days.
Initial download of the metrics may take a while.