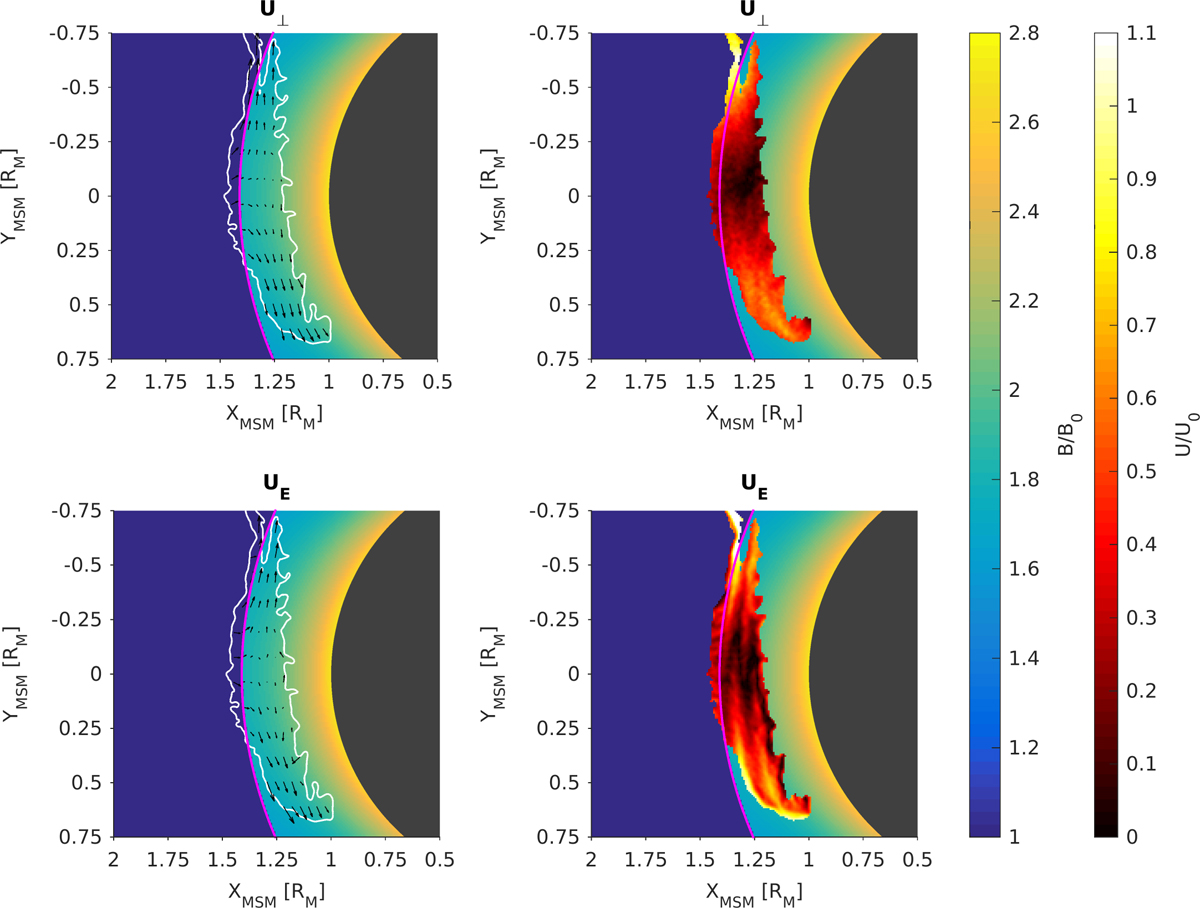
Fig. 5

Download original image
Perpendicular component of the plasma bulk velocity (top) and the zero-order (or electric) drift velocity (bottom) in the ZMSM = 0 cross-section inside the simulation domain for case A, at the end of run (ωLit = 10), illustrated with vectors (left) and color coded (right). The greenish color map shows the magnetic field normalized to its value outside the magnetosphere, while the reddish one the bulk or drift velocity normalized to the injection velocity. The white contour in the left panels encloses the high-density core of the plasma. The magenta curve is the magnetopause.
Current usage metrics show cumulative count of Article Views (full-text article views including HTML views, PDF and ePub downloads, according to the available data) and Abstracts Views on Vision4Press platform.
Data correspond to usage on the plateform after 2015. The current usage metrics is available 48-96 hours after online publication and is updated daily on week days.
Initial download of the metrics may take a while.


