Fig. 4

Download original image
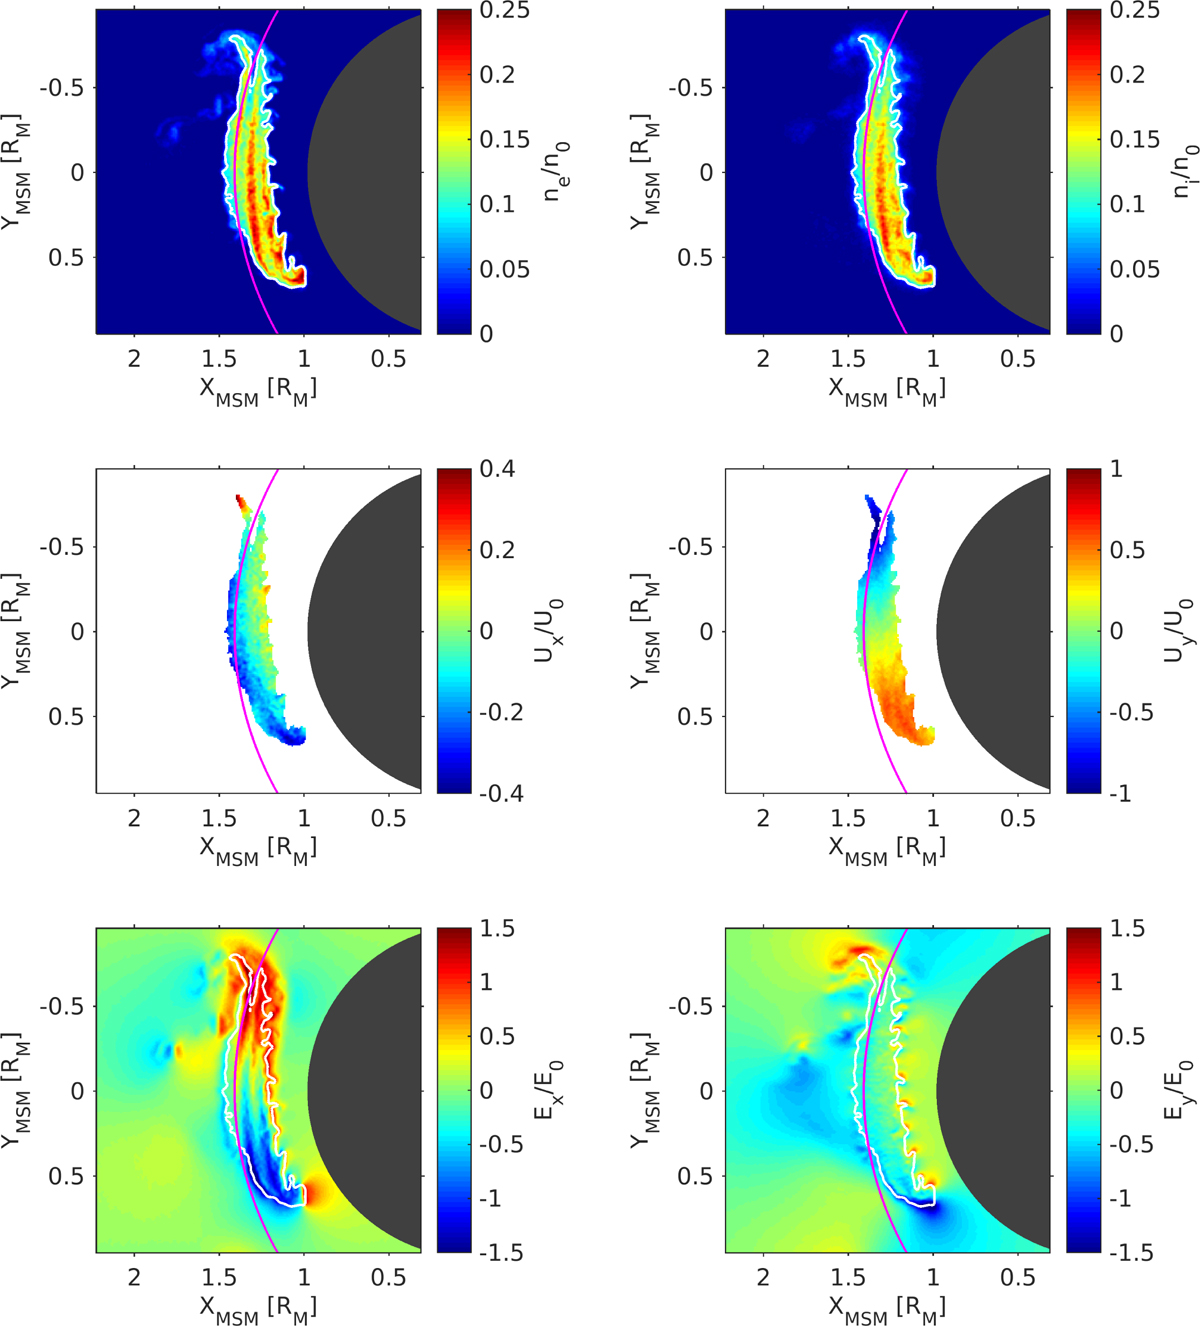
Cross-section ZMSM = 0 inside the simulation domain for case A: (top) electron and ion number densities, (middle) Ux and Uy components of the plasma bulk velocity, and (bottom) Ex and Ey components of the self-consistent electric field, normalized to their corresponding initial values, at the end of run (ωLit = 10). The white contour in the top and bottom panels marks the boundary that separates the higher density bulk of the plasma from its more tenuous regions. The magenta curve is the magnetopause.
Current usage metrics show cumulative count of Article Views (full-text article views including HTML views, PDF and ePub downloads, according to the available data) and Abstracts Views on Vision4Press platform.
Data correspond to usage on the plateform after 2015. The current usage metrics is available 48-96 hours after online publication and is updated daily on week days.
Initial download of the metrics may take a while.


