Fig. 3

Download original image
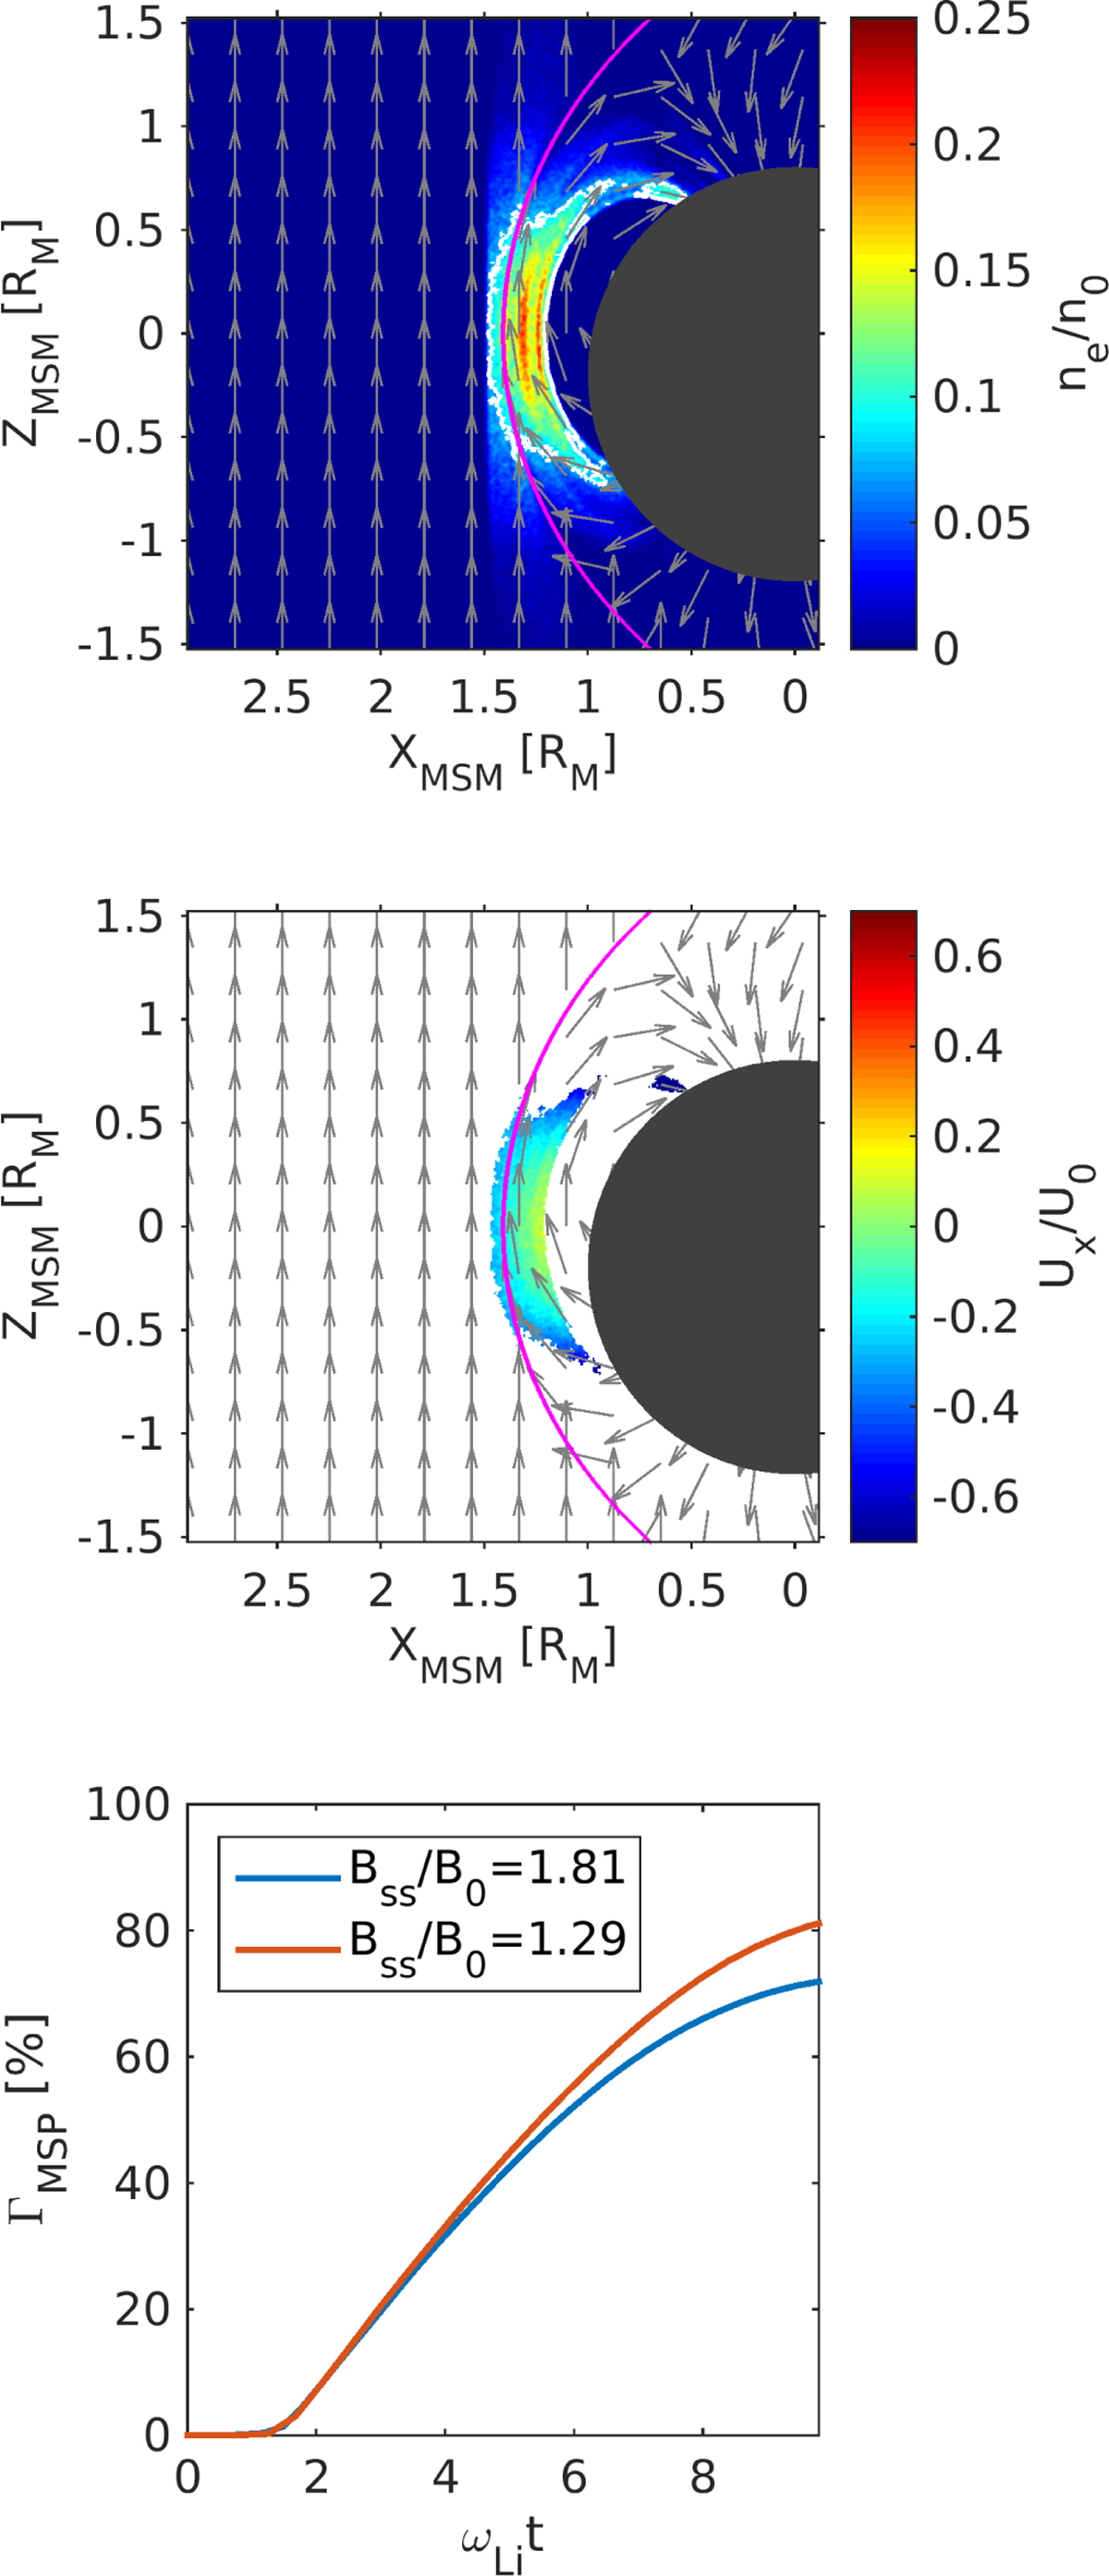
Cross-section YMSM = 0 inside the simulation domain for case A: (top) electron number density and (middle) plasma bulk velocity along the XMSM axis at the end of run (ωLit = 10), where ωLi is the ion Larmor frequency outside the magnetosphere. Both quantities are normalized to their corresponding initial values. The magenta curve illustrates the magnetopause, while the grey arrows indicate the background magnetic field unit vectors. Note: the small overlap of magnetic field vectors in different regions of the simulation domain is just an artifact. The magnetospheric penetration degree variation from initialization to the end of run for Bss/B0 = 1.81 is shown at bottom (blue curve) and Bss/B0 = 1.29 (red curve), where Bss is the magnetic field at the sub-solar magnetopause just inside the magnetosphere and B0 the magnetic field outside the magnetosphere.
Current usage metrics show cumulative count of Article Views (full-text article views including HTML views, PDF and ePub downloads, according to the available data) and Abstracts Views on Vision4Press platform.
Data correspond to usage on the plateform after 2015. The current usage metrics is available 48-96 hours after online publication and is updated daily on week days.
Initial download of the metrics may take a while.


