Fig. 1
Download original image
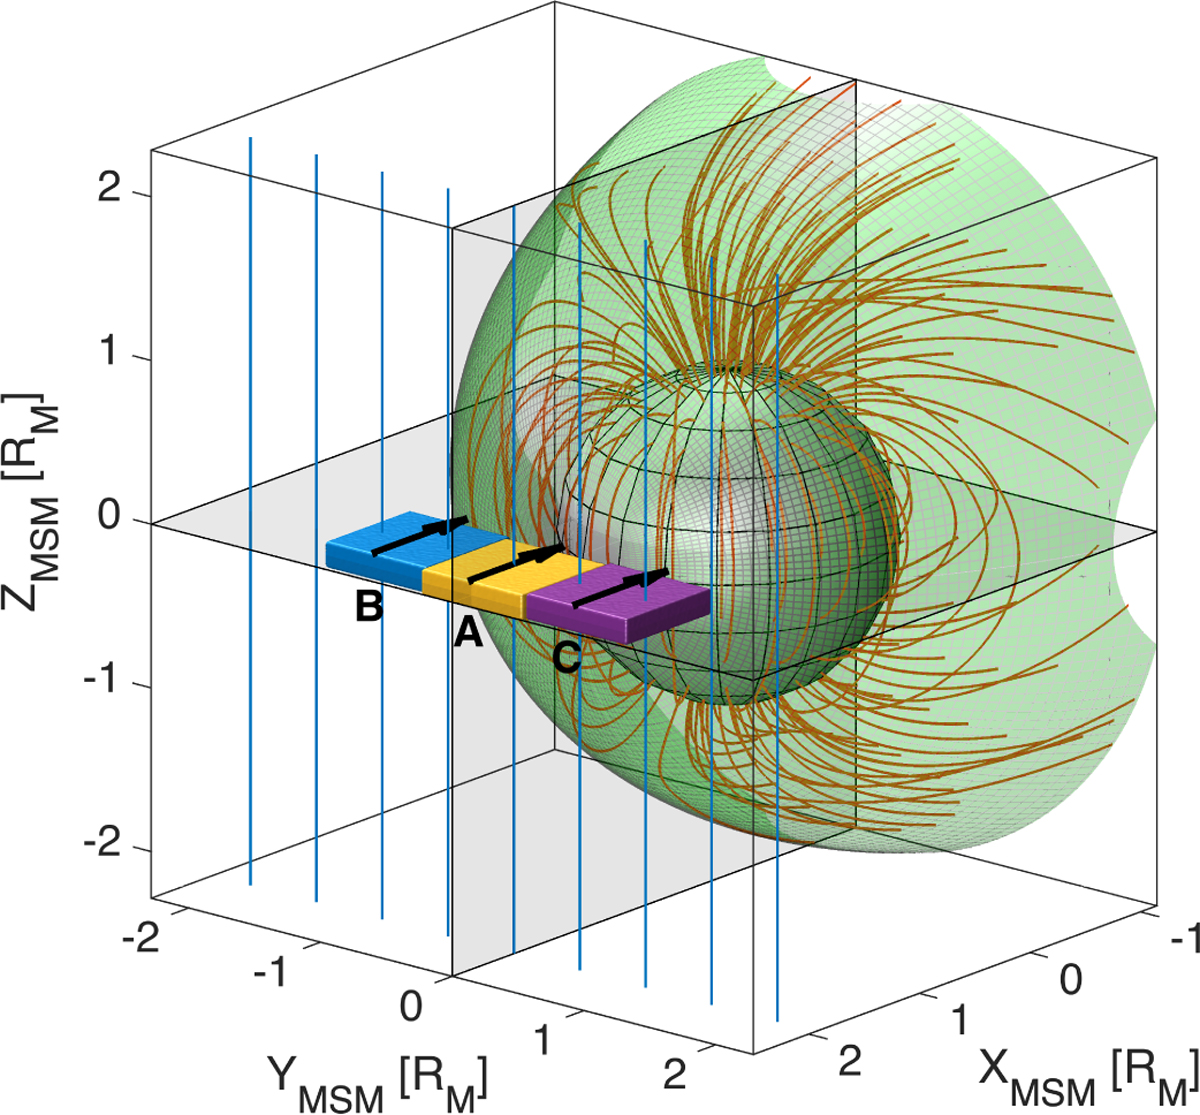
Simulation setup for cases A (frontal injection), B (dawn flank injection), and C (dusk flank injection) in the MSM reference frame. The Hermean magnetopause is drawn in green according to Shue’s model (Shue et al. 1997). The KT17 magnetic field lines (Korth et al. 2017) are represented in red, while the northward magnetic field lines outside Mercury’s magnetosphere are shown in blue. We illustrate with colored boxes the injection regions corresponding to the three simulated plasma structures: Yellow for case A, blue for case B, and purple for case C. The initial plasma bulk velocity is shown with black arrows.
Current usage metrics show cumulative count of Article Views (full-text article views including HTML views, PDF and ePub downloads, according to the available data) and Abstracts Views on Vision4Press platform.
Data correspond to usage on the plateform after 2015. The current usage metrics is available 48-96 hours after online publication and is updated daily on week days.
Initial download of the metrics may take a while.