Fig. 8
Download original image
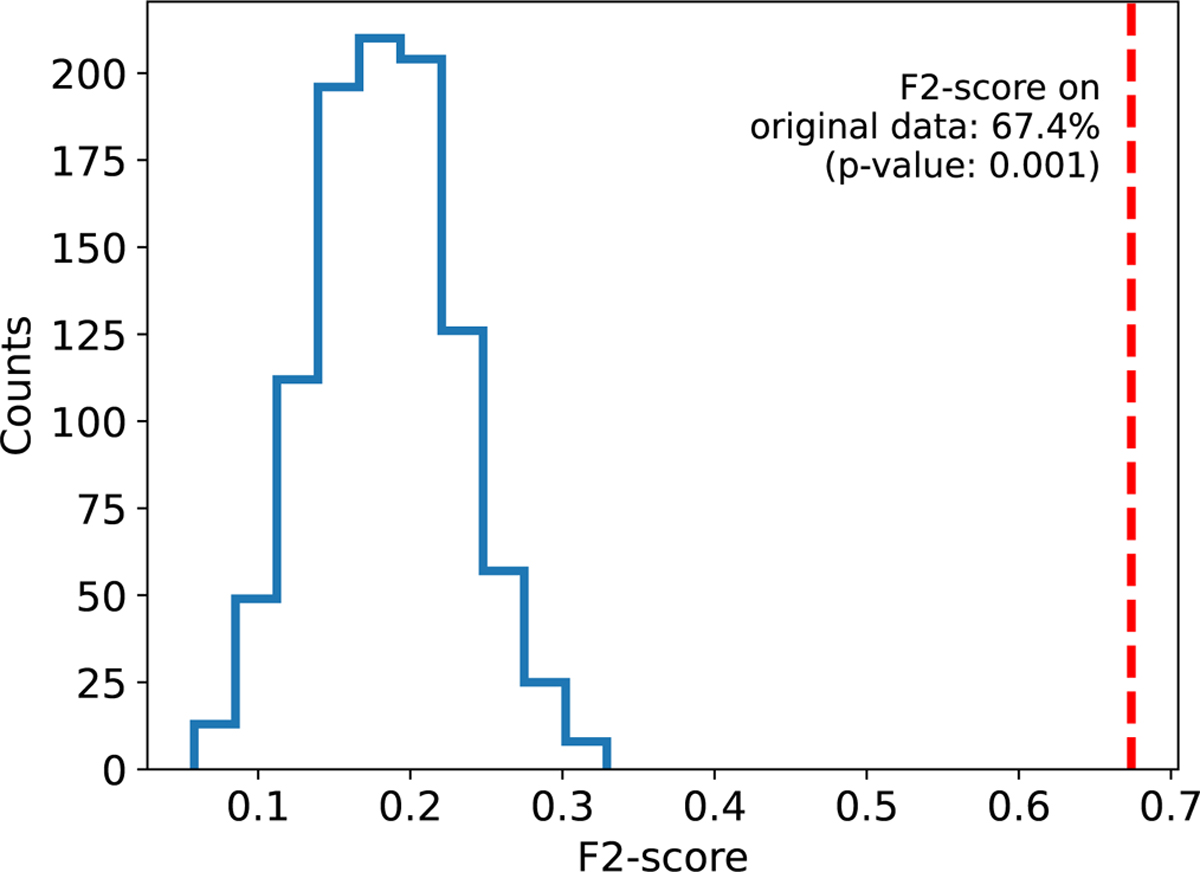
Permutation test scores. The red dashed line indicates the cross-validated F2-score of our RF classifier on the training data. The blue histogram shows the cross-validated F2-score of our RF classifier on the training data when the corresponding labels are randomly permuted. We repeated the shuffling of the labels and cross-validated score assessment 1000 times with different random seeds. The difference between the scores for the permuted data and those for the original data indicates the significance of our trained model.
Current usage metrics show cumulative count of Article Views (full-text article views including HTML views, PDF and ePub downloads, according to the available data) and Abstracts Views on Vision4Press platform.
Data correspond to usage on the plateform after 2015. The current usage metrics is available 48-96 hours after online publication and is updated daily on week days.
Initial download of the metrics may take a while.