Fig. 2
Download original image
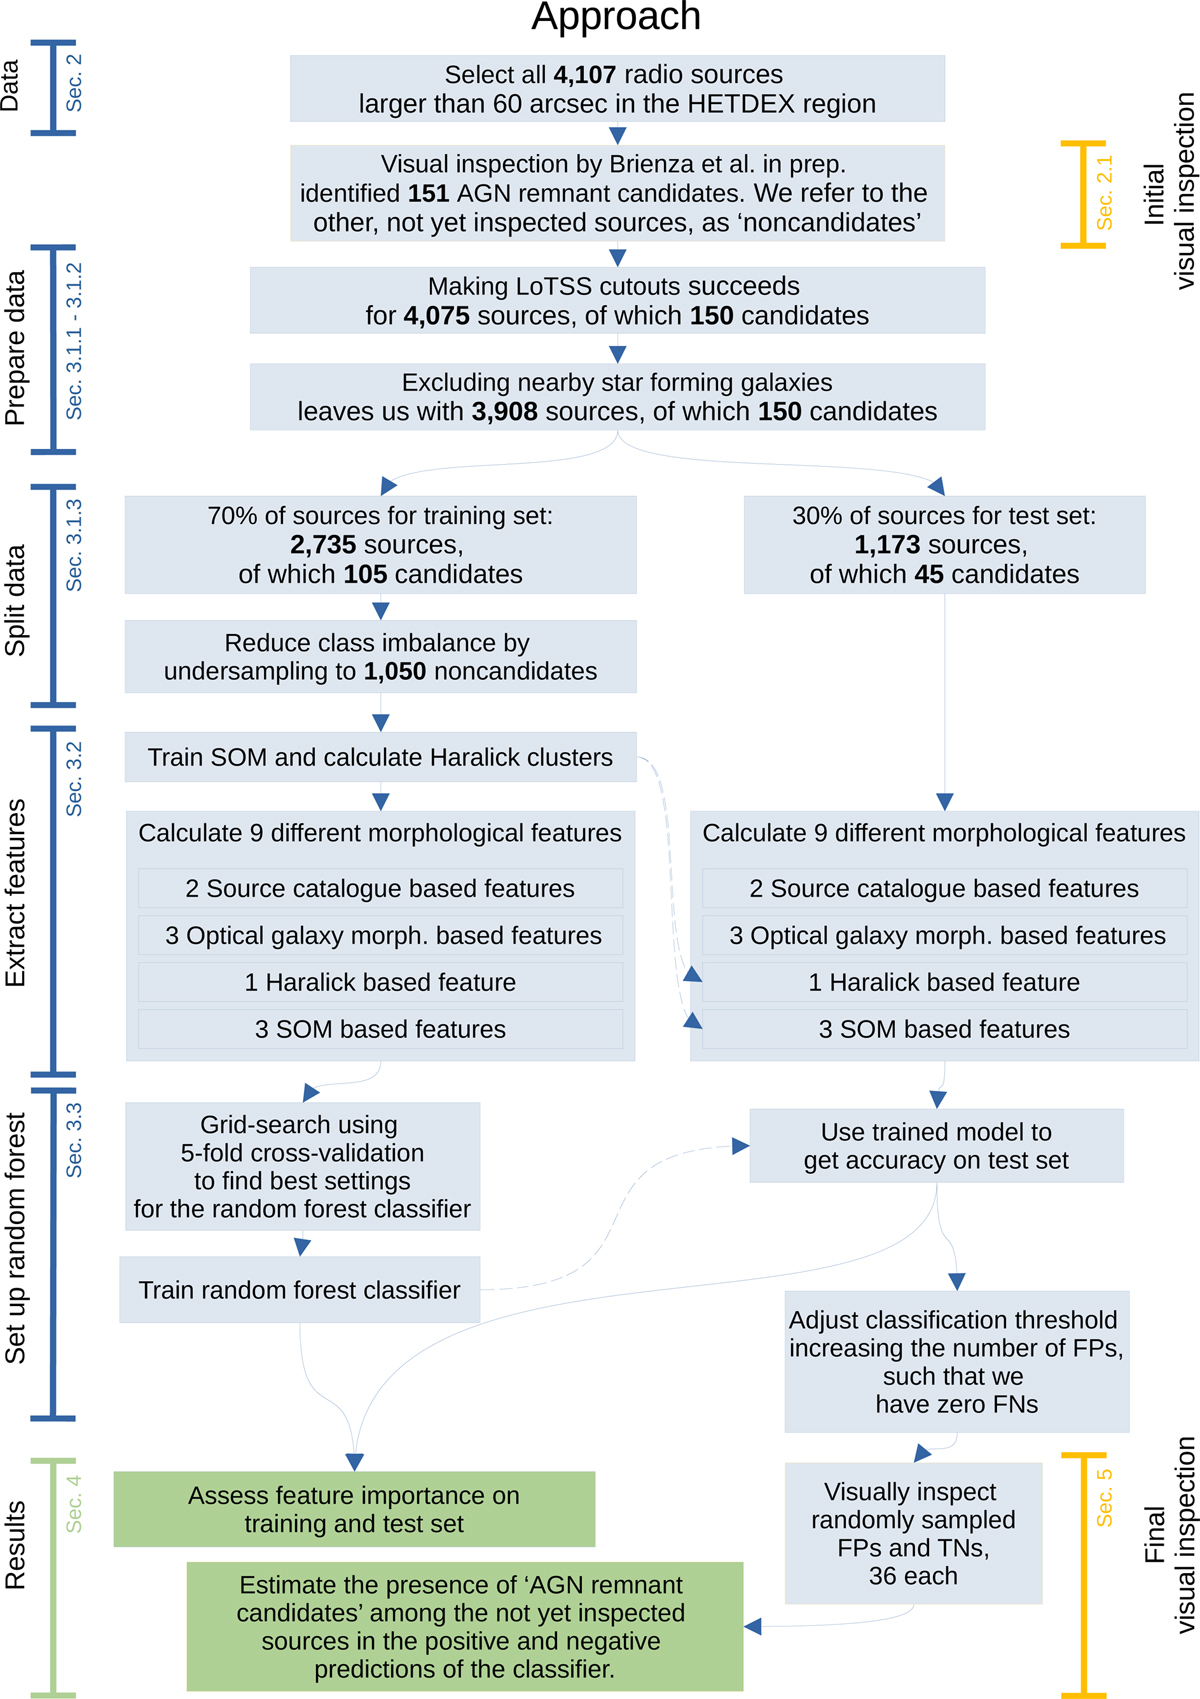
Diagram of our approach to create a model that classifies radio sources as either ‘AGN remnant candidate’ or ‘non-candidate’ based on a number of morphological features. The solid arrows show the flow of our data, while the dashed arrows indicate the use of various trained models, specifically a SOM, HDBSCAN* clustered Haralick features, and a RF, all trained using only the data from the (undersampled) training set. The brackets indicate the different stages of our method and mention the sections in which corresponding details can be found.
Current usage metrics show cumulative count of Article Views (full-text article views including HTML views, PDF and ePub downloads, according to the available data) and Abstracts Views on Vision4Press platform.
Data correspond to usage on the plateform after 2015. The current usage metrics is available 48-96 hours after online publication and is updated daily on week days.
Initial download of the metrics may take a while.