Fig. 7
Download original image
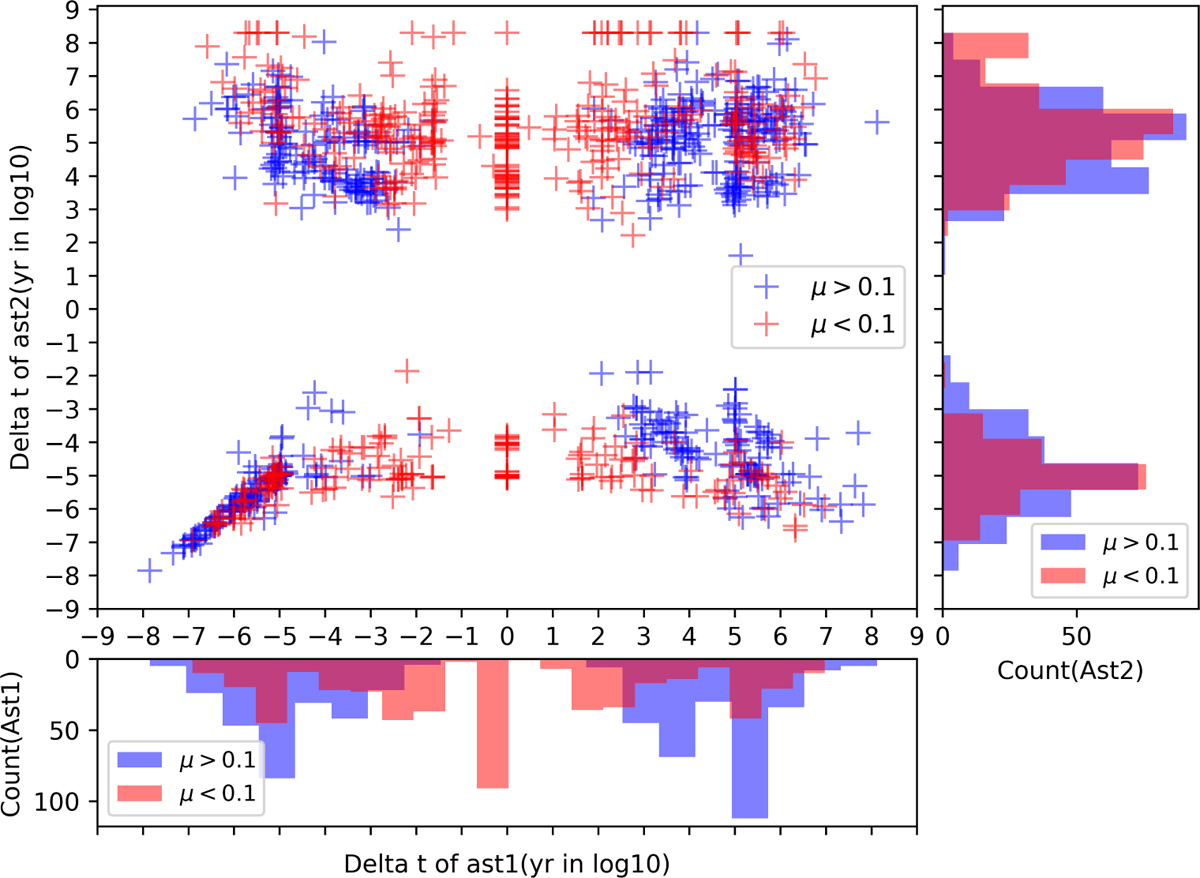
Change in the accretion time for Ast1 and Ast2. Center shows the major plot where the x-axis is the change in Ast1 and the y-axis is the change in Ast2. The axes are in log scale. All changes in the accretion time are larger than a year and a negative value here means that the accretion time is earlier than without binary dissociation. It can be explained by this equation: ![]() · log(| Δt1 |) and
· log(| Δt1 |) and ![]() · log(| Δt2 |). Besides the major plot, the two histograms are the distribution of the change for Ast1 (bottom) and Ast2(right), two colors representing different μ. Their scales are the same as the main plot.
· log(| Δt2 |). Besides the major plot, the two histograms are the distribution of the change for Ast1 (bottom) and Ast2(right), two colors representing different μ. Their scales are the same as the main plot.
Current usage metrics show cumulative count of Article Views (full-text article views including HTML views, PDF and ePub downloads, according to the available data) and Abstracts Views on Vision4Press platform.
Data correspond to usage on the plateform after 2015. The current usage metrics is available 48-96 hours after online publication and is updated daily on week days.
Initial download of the metrics may take a while.