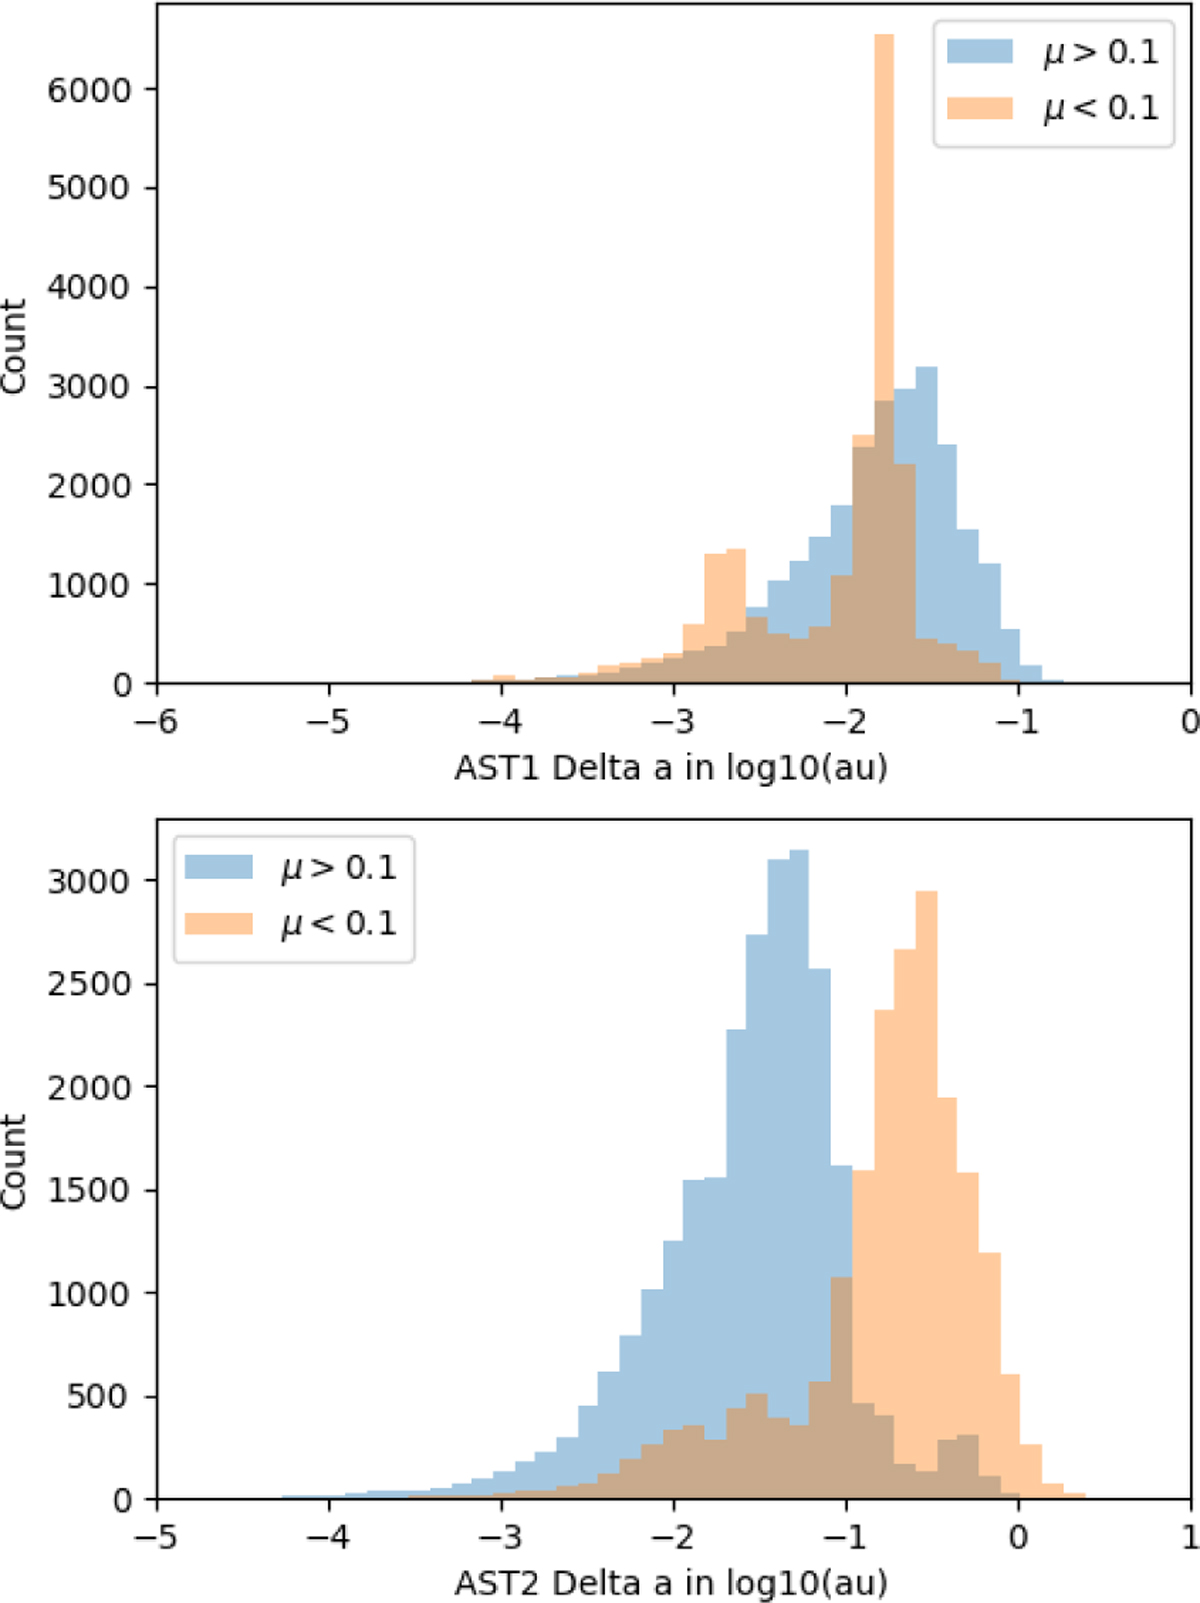
Fig. 6
Download original image
Distribution of the changes of the semi-major axis after the dissociation. Upper panel: distribution for Ast1 and the lower panel is for Ast2. Two ranges of μ are represented by different colors, blue for μ > 0.1 and orange for μ < 0.1. The difference is the logarithmic of the absolute value of the change. (log10(|aafter − abefore|)).
Current usage metrics show cumulative count of Article Views (full-text article views including HTML views, PDF and ePub downloads, according to the available data) and Abstracts Views on Vision4Press platform.
Data correspond to usage on the plateform after 2015. The current usage metrics is available 48-96 hours after online publication and is updated daily on week days.
Initial download of the metrics may take a while.