Fig. 4
Download original image
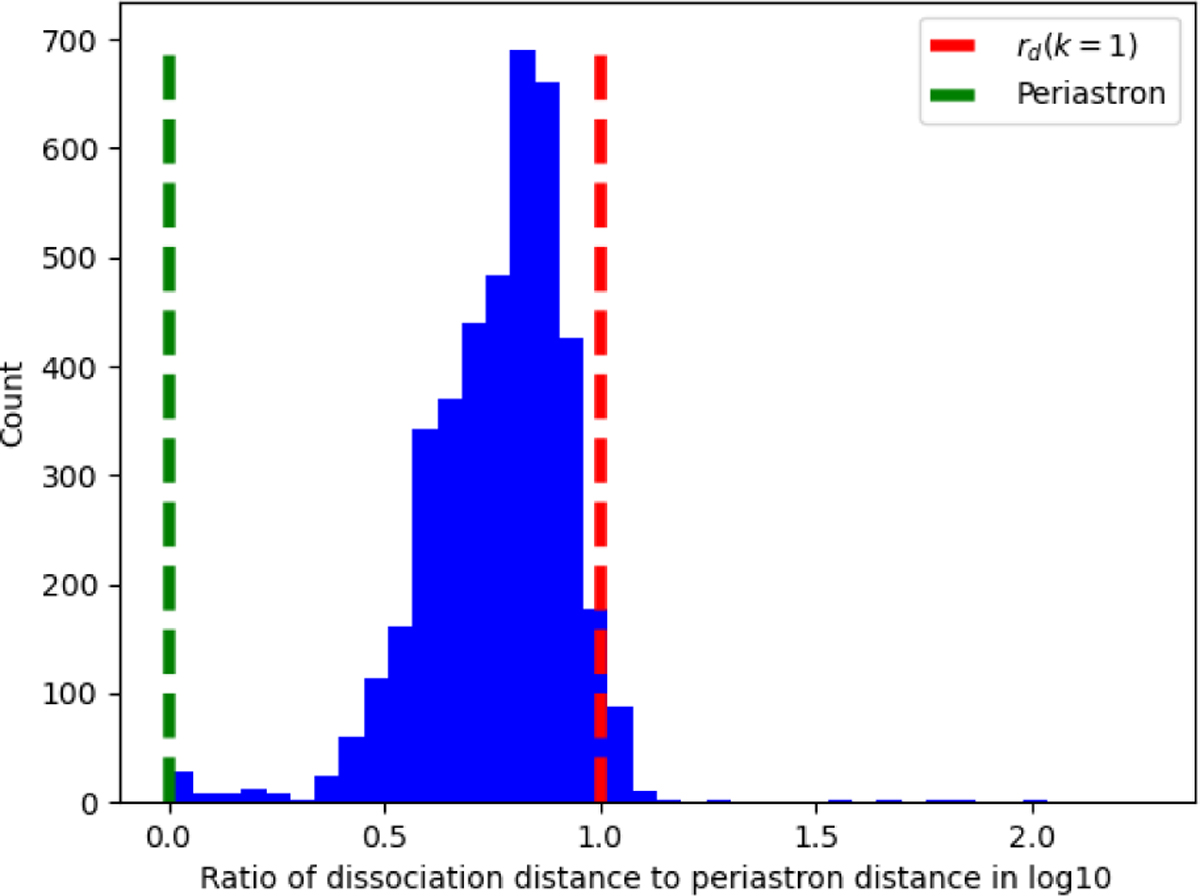
Distribution of the ratio of disruption distance to periastron distance. The x-axis is logarithmic of the dissociation distance over periastron distance. Red dashed line represents the distance of sd (k = 1), and the green dashed line is the periastron distance. In this simulation, we set the periastron distance as 0.1 sd (k = 1).
Current usage metrics show cumulative count of Article Views (full-text article views including HTML views, PDF and ePub downloads, according to the available data) and Abstracts Views on Vision4Press platform.
Data correspond to usage on the plateform after 2015. The current usage metrics is available 48-96 hours after online publication and is updated daily on week days.
Initial download of the metrics may take a while.