Fig. 2
Download original image
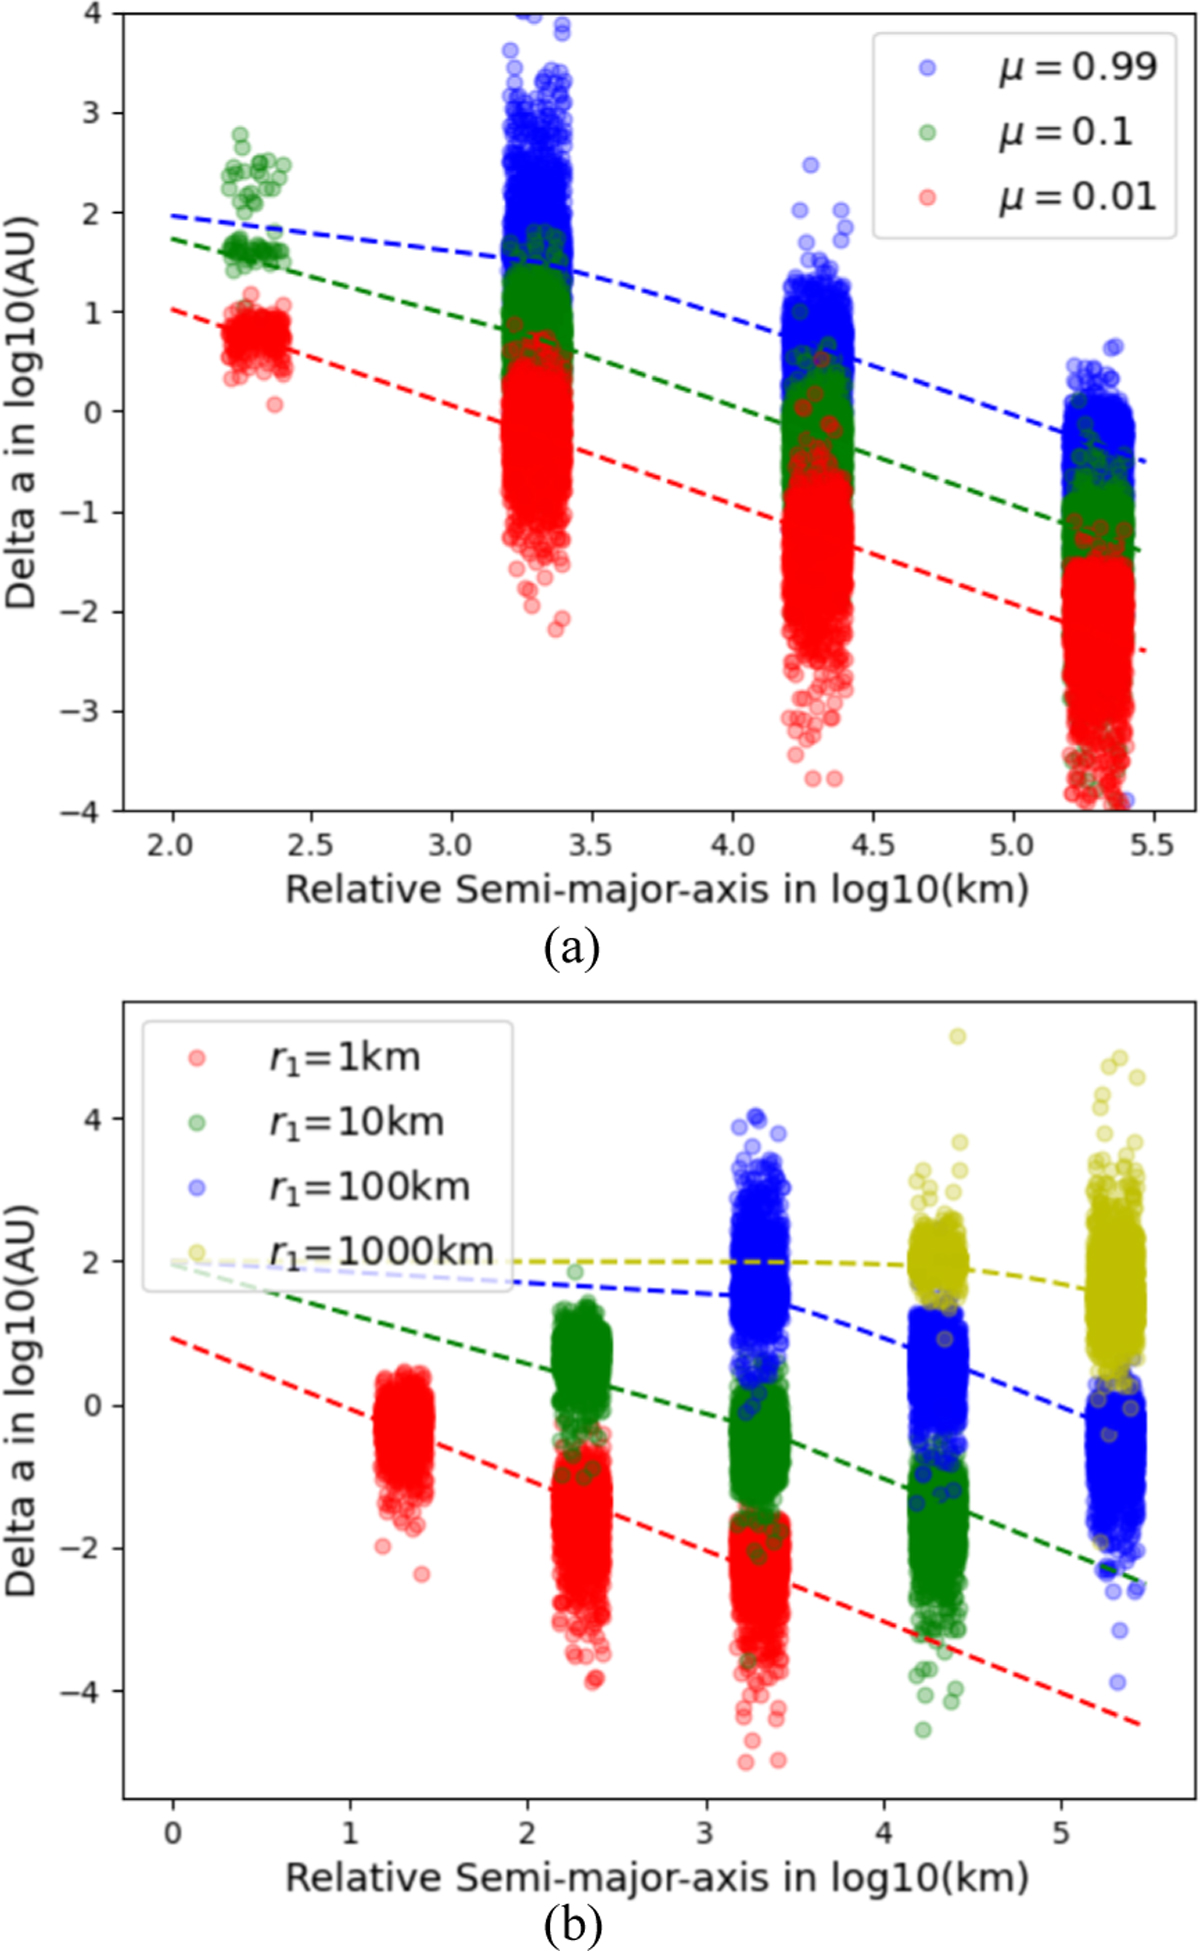
Dependence of Δa(For Ast1) on the binary asteroid’s relative orbit. The x-axis is the semi-major axis of binary relative orbit the y-axis is the change in the semi-major axis, both in log scale. Dots are from the grid simulations. To make the plot clearer, the dots have been shifted horizontally by a small but random amount (otherwise there are only four values for the x-axis: 200km, 2000 km, 20 000 km and 200 000 km). For panel a, Different colors are used for different μ (red 0.01, green 0.1, blue 0.99). The radii of Ast1 r1 is 100 km. The three dashed lines are the predictions of Eq. (8). For panel b, different colors are used for different r1 (red 1 km, green 10 km, blue 100 km, yellow 1000 km). The mass ratio μ is 0.99. The four dashed lines are the predictions of Eq. (7).
Current usage metrics show cumulative count of Article Views (full-text article views including HTML views, PDF and ePub downloads, according to the available data) and Abstracts Views on Vision4Press platform.
Data correspond to usage on the plateform after 2015. The current usage metrics is available 48-96 hours after online publication and is updated daily on week days.
Initial download of the metrics may take a while.