Fig. 1
Download original image
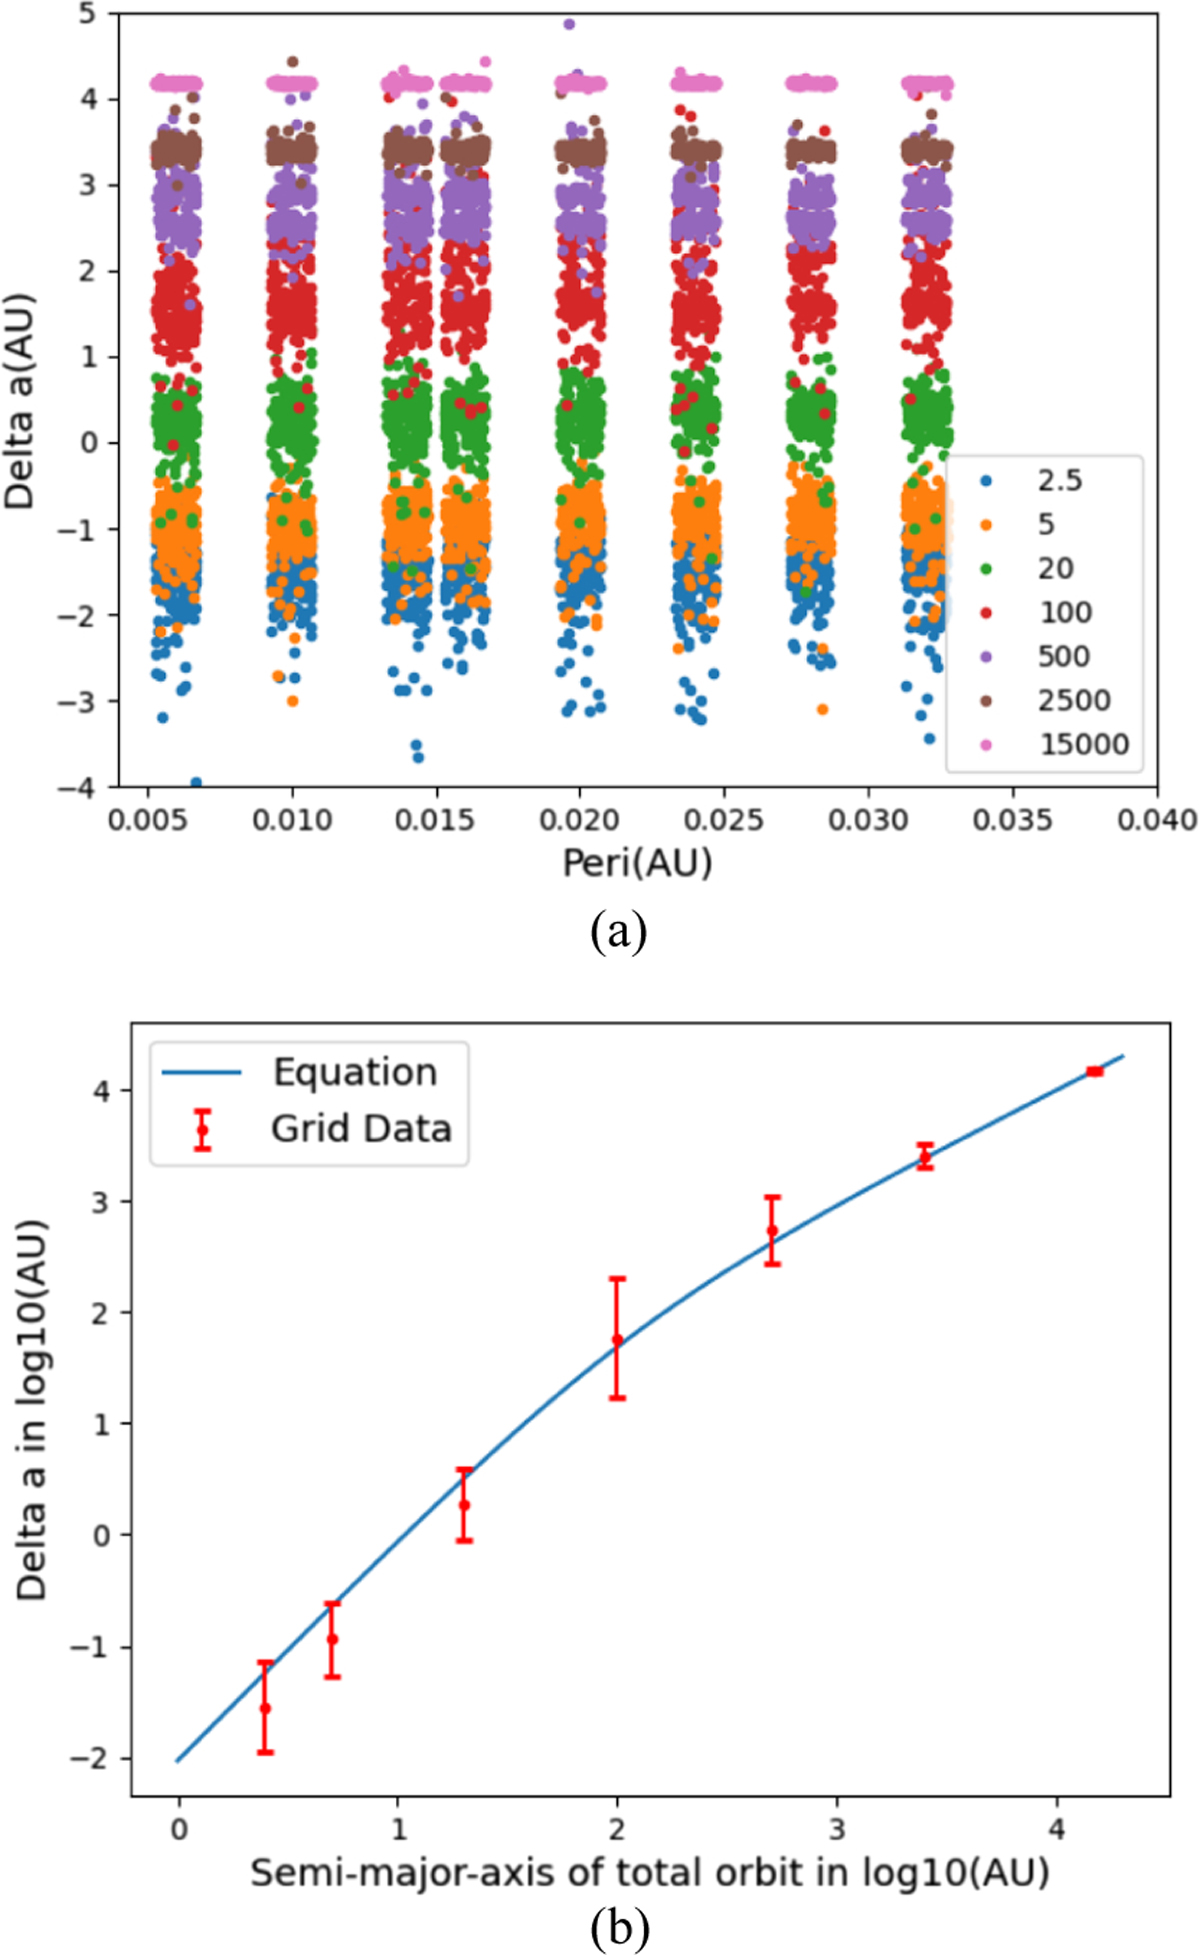
Dependence of ∆a(For Ast1) on the binary asteroid’s total orbit. Panel a shows the result of our grid simulation, where the size of Ast1 is 100 km, μ = 0.99 and the semi-major axis of the relative orbit is 2000 km. The x-axis is the periastron distance of the binary’s total orbit, and the y-axis is the change in semi-major axis (Ast1) which is presented in log scale. The different colors mean the different semi-major axis of the binaries’ total orbit. The dots have been shifted horizontally by a small but random amount for better visibility. Panel b shows the relationship between atot − a1 and atot. The blue line comes from Eq. (7). The red dots are the mean value of our grid simulation and the error here is the standard deviation.
Current usage metrics show cumulative count of Article Views (full-text article views including HTML views, PDF and ePub downloads, according to the available data) and Abstracts Views on Vision4Press platform.
Data correspond to usage on the plateform after 2015. The current usage metrics is available 48-96 hours after online publication and is updated daily on week days.
Initial download of the metrics may take a while.