Fig. 8
Download original image
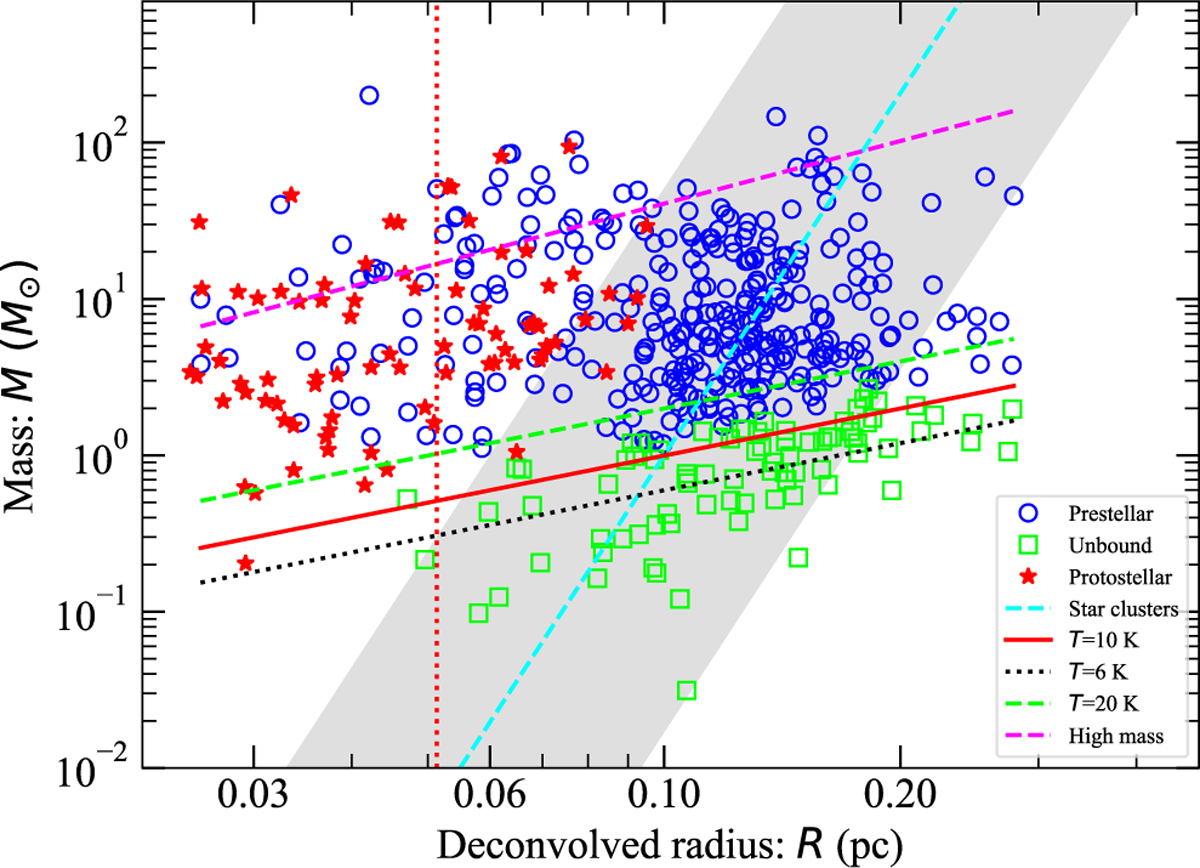
Mass-size diagram for Vela C for the unbound cores (green squares), prestellar cores (blue circles), and protostellar cores (red stars). Only the partially resolved and resolved cores are shown (with sizes 10% larger than the 11.7″ beam) to ensure acceptably accurate decon-volution results using Eq. (4). The critical Bonnor-Ebert spheres with temperatures of 6, 10, and 20 Κ are displayed by the dashed black, dashed green, and solid red lines, respectively. The dashed cyan line is the radius-mass relation for open star clusters (Marks & Kroupa 2012, Eq. (7)) and the gray envelope represents its uncertainty range. The dashed magenta line indicates an empirical relationship proposed by Kauffmann et al. (2010). The physical scale of 0.05 pc at the 11.7″ resolution is indicated by the vertical line.
Current usage metrics show cumulative count of Article Views (full-text article views including HTML views, PDF and ePub downloads, according to the available data) and Abstracts Views on Vision4Press platform.
Data correspond to usage on the plateform after 2015. The current usage metrics is available 48-96 hours after online publication and is updated daily on week days.
Initial download of the metrics may take a while.