Fig. 10
Download original image
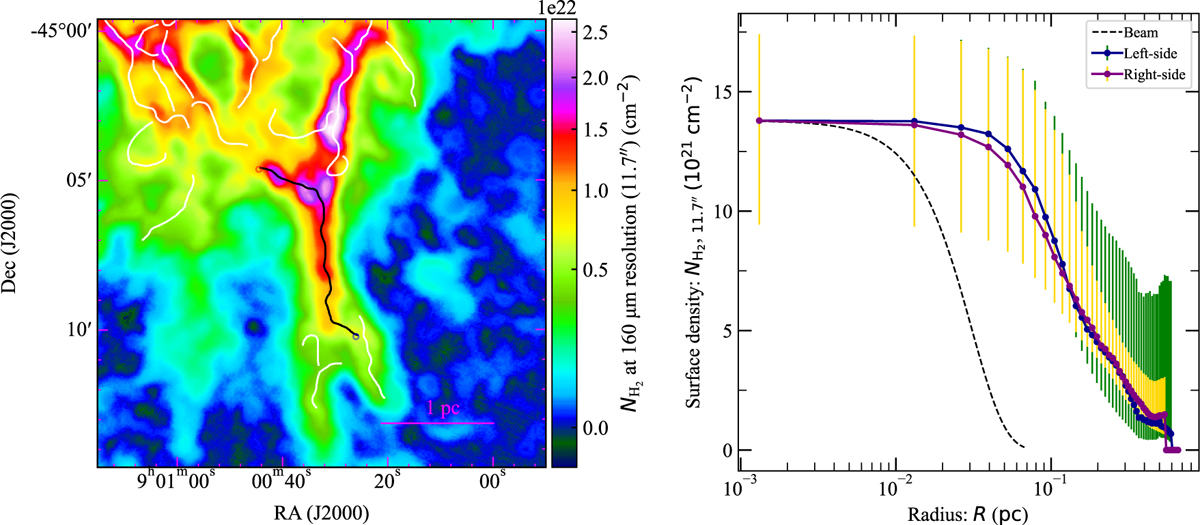
Illustration of a detected and measured filament in a high-resolution surface density image at 11.7″. Left: skeletons of the detected filaments with a contrast C > 0.5 is shown by the white curves and the black curve is the skeleton of a filament whose measured radial profile is shown in the right panel. Right: median one-sided surface density profiles measured on the two sides of the filament (blue and purple solid lines). The black dashed curve shows the beam profile. The median half maximum width of the filament is 0.33 ± 0.19 pc.
Current usage metrics show cumulative count of Article Views (full-text article views including HTML views, PDF and ePub downloads, according to the available data) and Abstracts Views on Vision4Press platform.
Data correspond to usage on the plateform after 2015. The current usage metrics is available 48-96 hours after online publication and is updated daily on week days.
Initial download of the metrics may take a while.