Fig. 3
Download original image
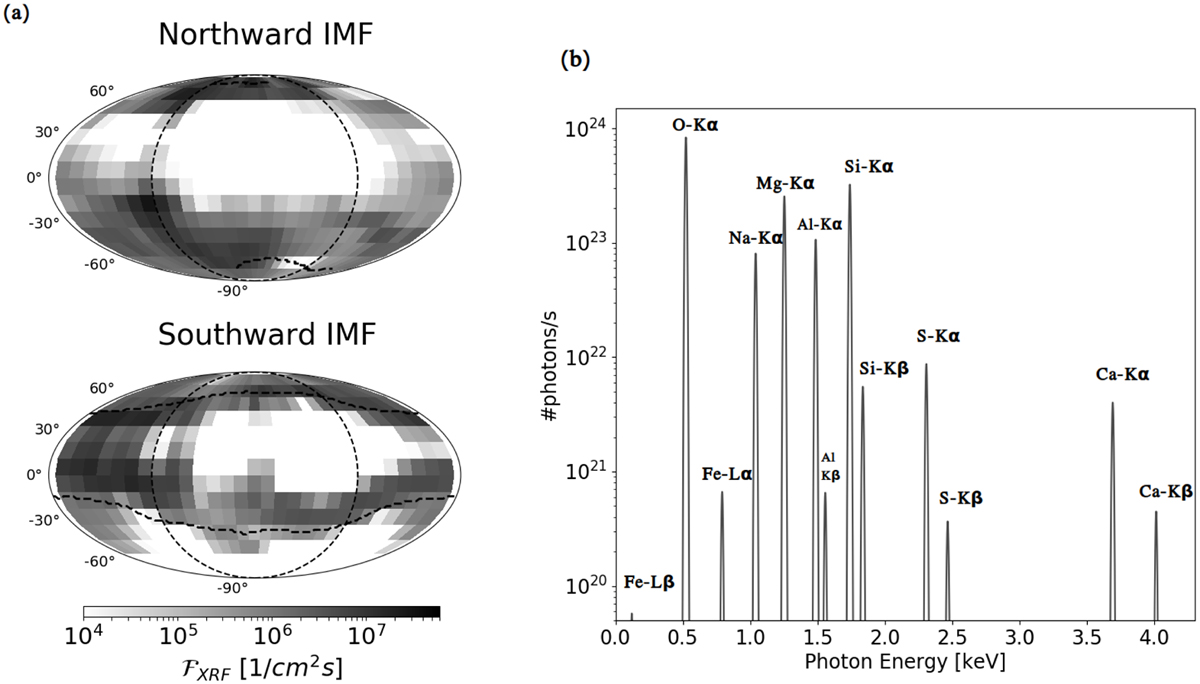
X-ray emissions from the surface of Mercury induced from high-energy electron precipitation. Panel a: maps (same format as Fig. 1) showing the total X-ray photon flux emitted from the surface in our two runs, as computed in Eq. (2). Panel b: INTENSITY of the different X-ray emission lines considered in this study. The intensity of these lines corresponds to the surface integral of the X-ray photon flux FXRFs in Eq. (2). To better visualize the lines, a Gaussian profile with a width of 5 eV is used.
Current usage metrics show cumulative count of Article Views (full-text article views including HTML views, PDF and ePub downloads, according to the available data) and Abstracts Views on Vision4Press platform.
Data correspond to usage on the plateform after 2015. The current usage metrics is available 48-96 hours after online publication and is updated daily on week days.
Initial download of the metrics may take a while.