Fig. 6
Download original image
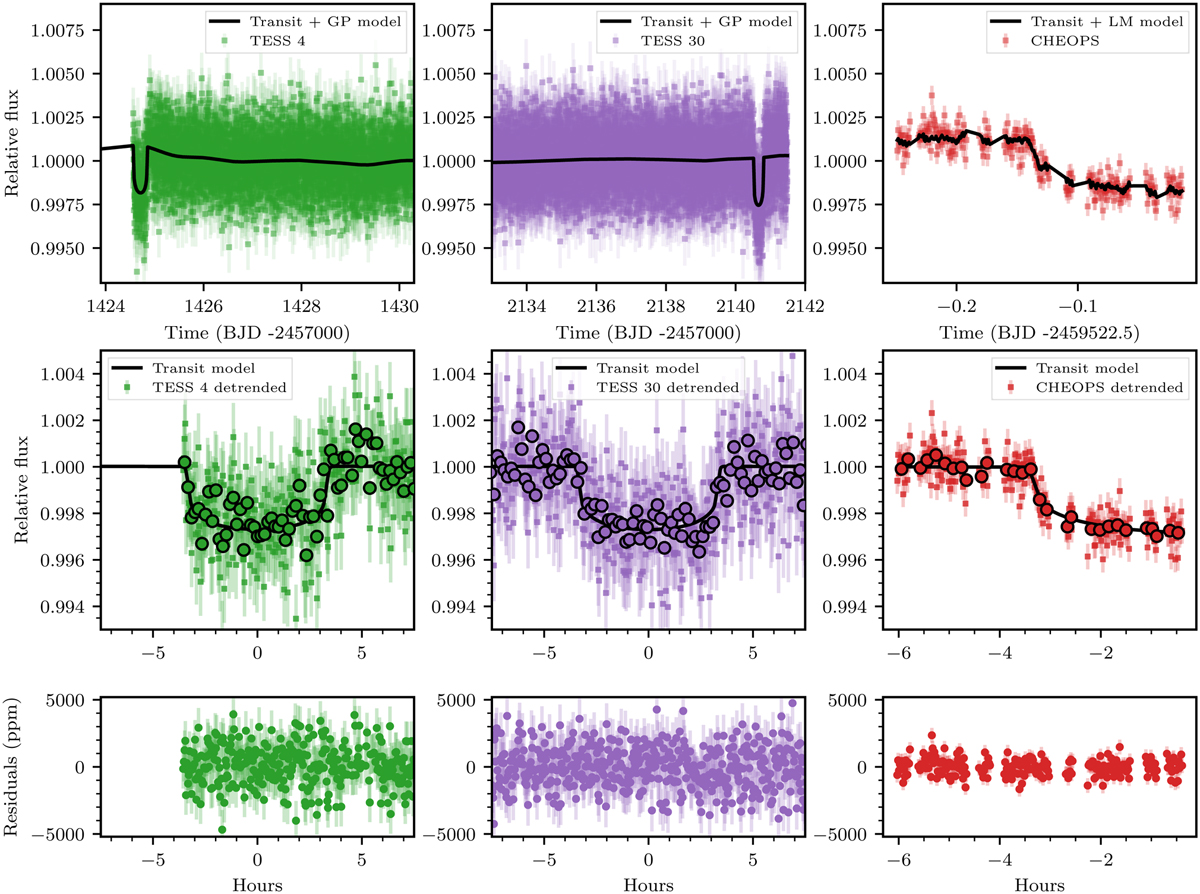
Photometric observations of TOI-5678. Top row: Light curves from both TESS sectors (green and purple dots) and CHEOPS observation (red dots). The full median model is plotted as a black line. Middle row: detrended and phase-folded data from both TESS sectors (green and purple dots) and the CHEOPS observation (red dots). The phase-folded transit model is displayed in black. The dots outlined in black in all three panels show the ten-minute binned data. Bottom row: residuals in parts per million between the full model and the respective light curve.
Current usage metrics show cumulative count of Article Views (full-text article views including HTML views, PDF and ePub downloads, according to the available data) and Abstracts Views on Vision4Press platform.
Data correspond to usage on the plateform after 2015. The current usage metrics is available 48-96 hours after online publication and is updated daily on week days.
Initial download of the metrics may take a while.