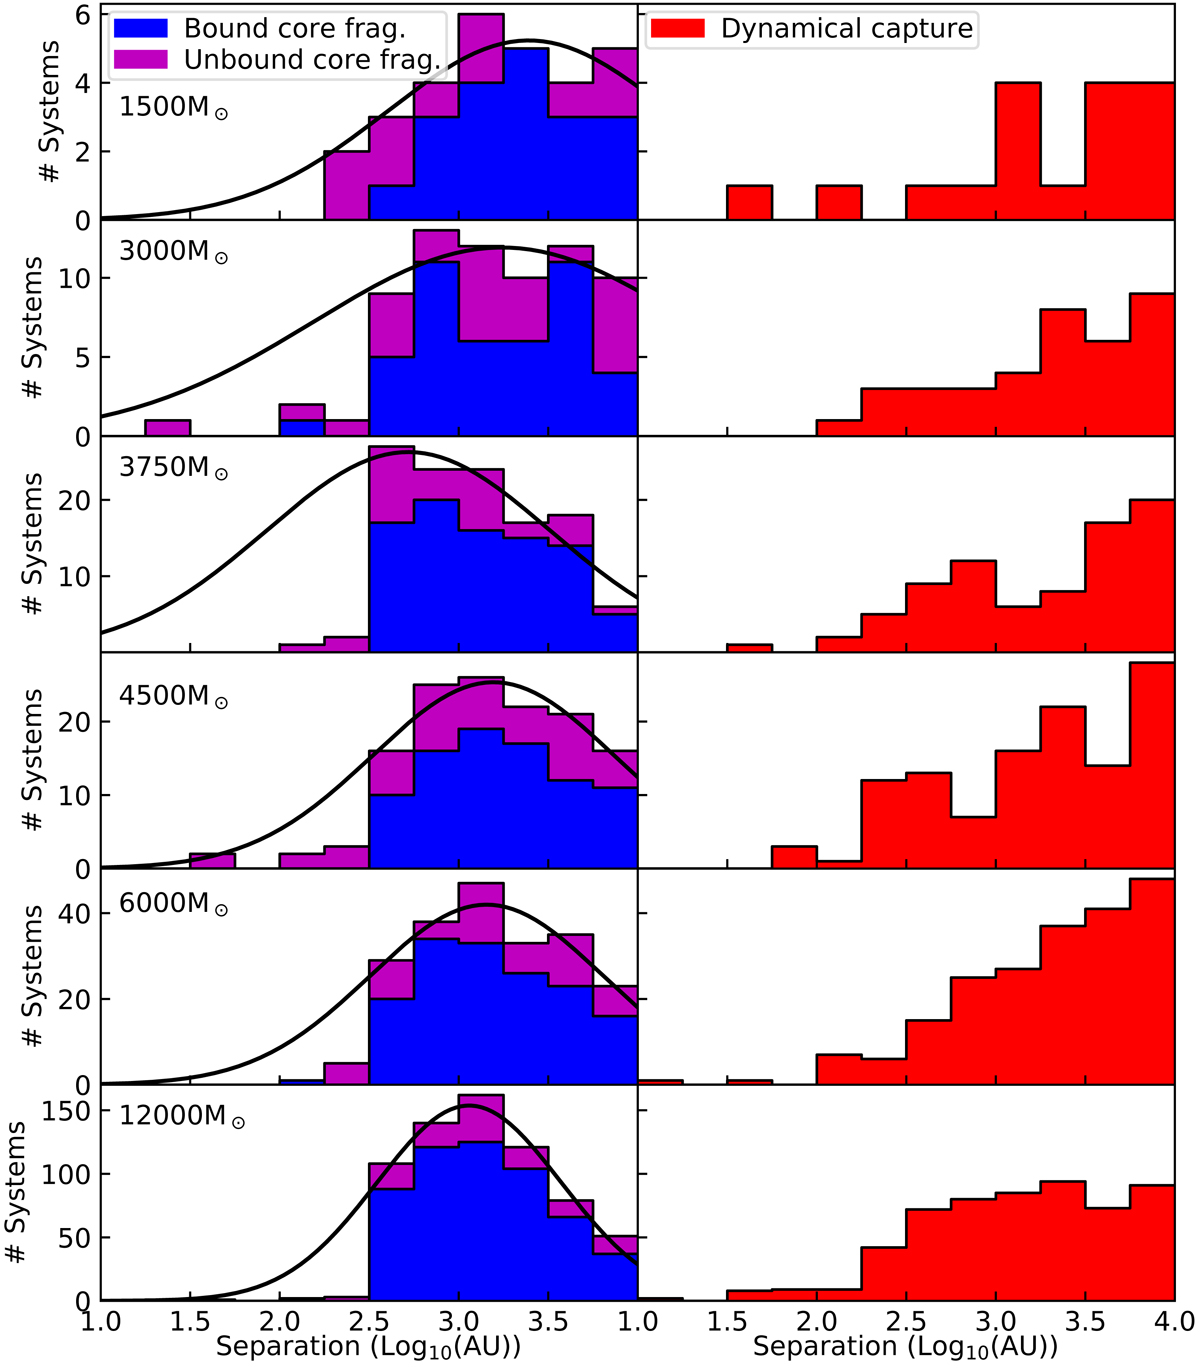
Fig. 9.
Download original image
Histograms of the initial separations of systems with new sink IDs for each simulation, for the three different formation pathways: blue: bound core fragmentation, purple: unbound core fragmentation, and red: dynamical capture. The separations were binned in log (separation), and the histogram for unbound core fragmentation is stacked on top of the bound core fragmentation histogram. The black line is the fitted Gaussian to the core fragmentation distribution.
Current usage metrics show cumulative count of Article Views (full-text article views including HTML views, PDF and ePub downloads, according to the available data) and Abstracts Views on Vision4Press platform.
Data correspond to usage on the plateform after 2015. The current usage metrics is available 48-96 hours after online publication and is updated daily on week days.
Initial download of the metrics may take a while.