Open Access
Fig. 8.
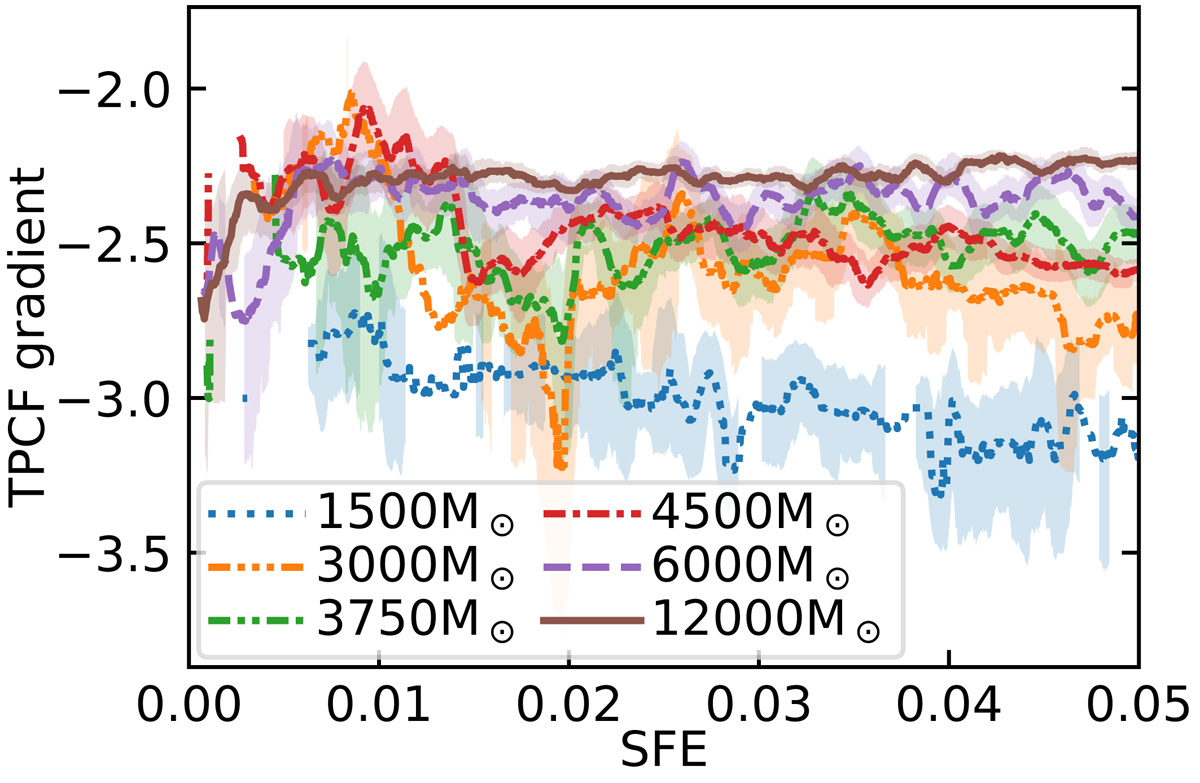
Download original image
Gradient of two-point correlation function (TPCF) over each simulation. The smoothing was carried out in the same way as Fig. 5, however, the shaded region shows the sum of the 1σ error on the power-law index and the 1σ variation in a smoothing window.
Current usage metrics show cumulative count of Article Views (full-text article views including HTML views, PDF and ePub downloads, according to the available data) and Abstracts Views on Vision4Press platform.
Data correspond to usage on the plateform after 2015. The current usage metrics is available 48-96 hours after online publication and is updated daily on week days.
Initial download of the metrics may take a while.