Open Access
Fig. 7.
Download original image
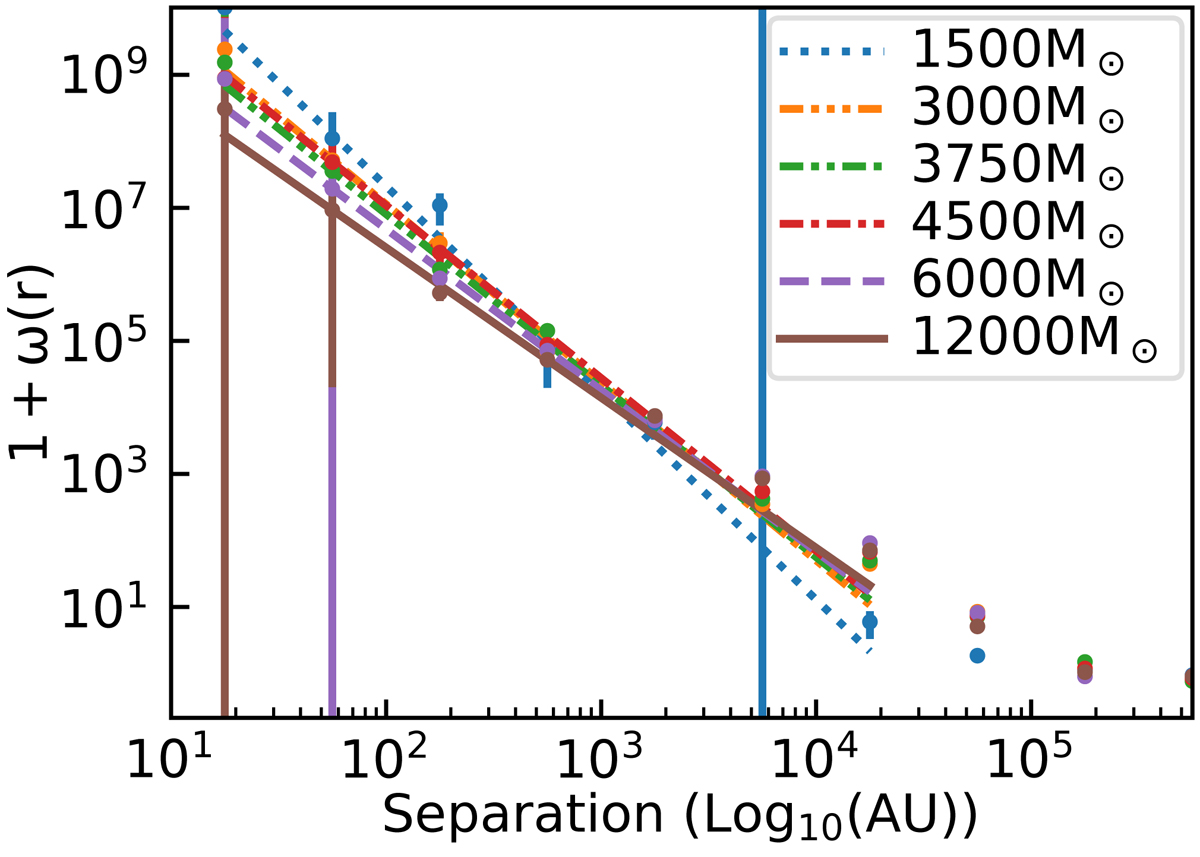
Two point correlation functions (TPCF) of all simulations at SFE = 0.05. The error bars on the points are the standard deviation of the TPCF values calculated against the 100 generated instances of a uniform distribution. The lines are the power law fits derived from the TPCFs up to 1 − 3 × 10⁴ AU separation bin.
Current usage metrics show cumulative count of Article Views (full-text article views including HTML views, PDF and ePub downloads, according to the available data) and Abstracts Views on Vision4Press platform.
Data correspond to usage on the plateform after 2015. The current usage metrics is available 48-96 hours after online publication and is updated daily on week days.
Initial download of the metrics may take a while.