Open Access
Fig. 4.
Download original image
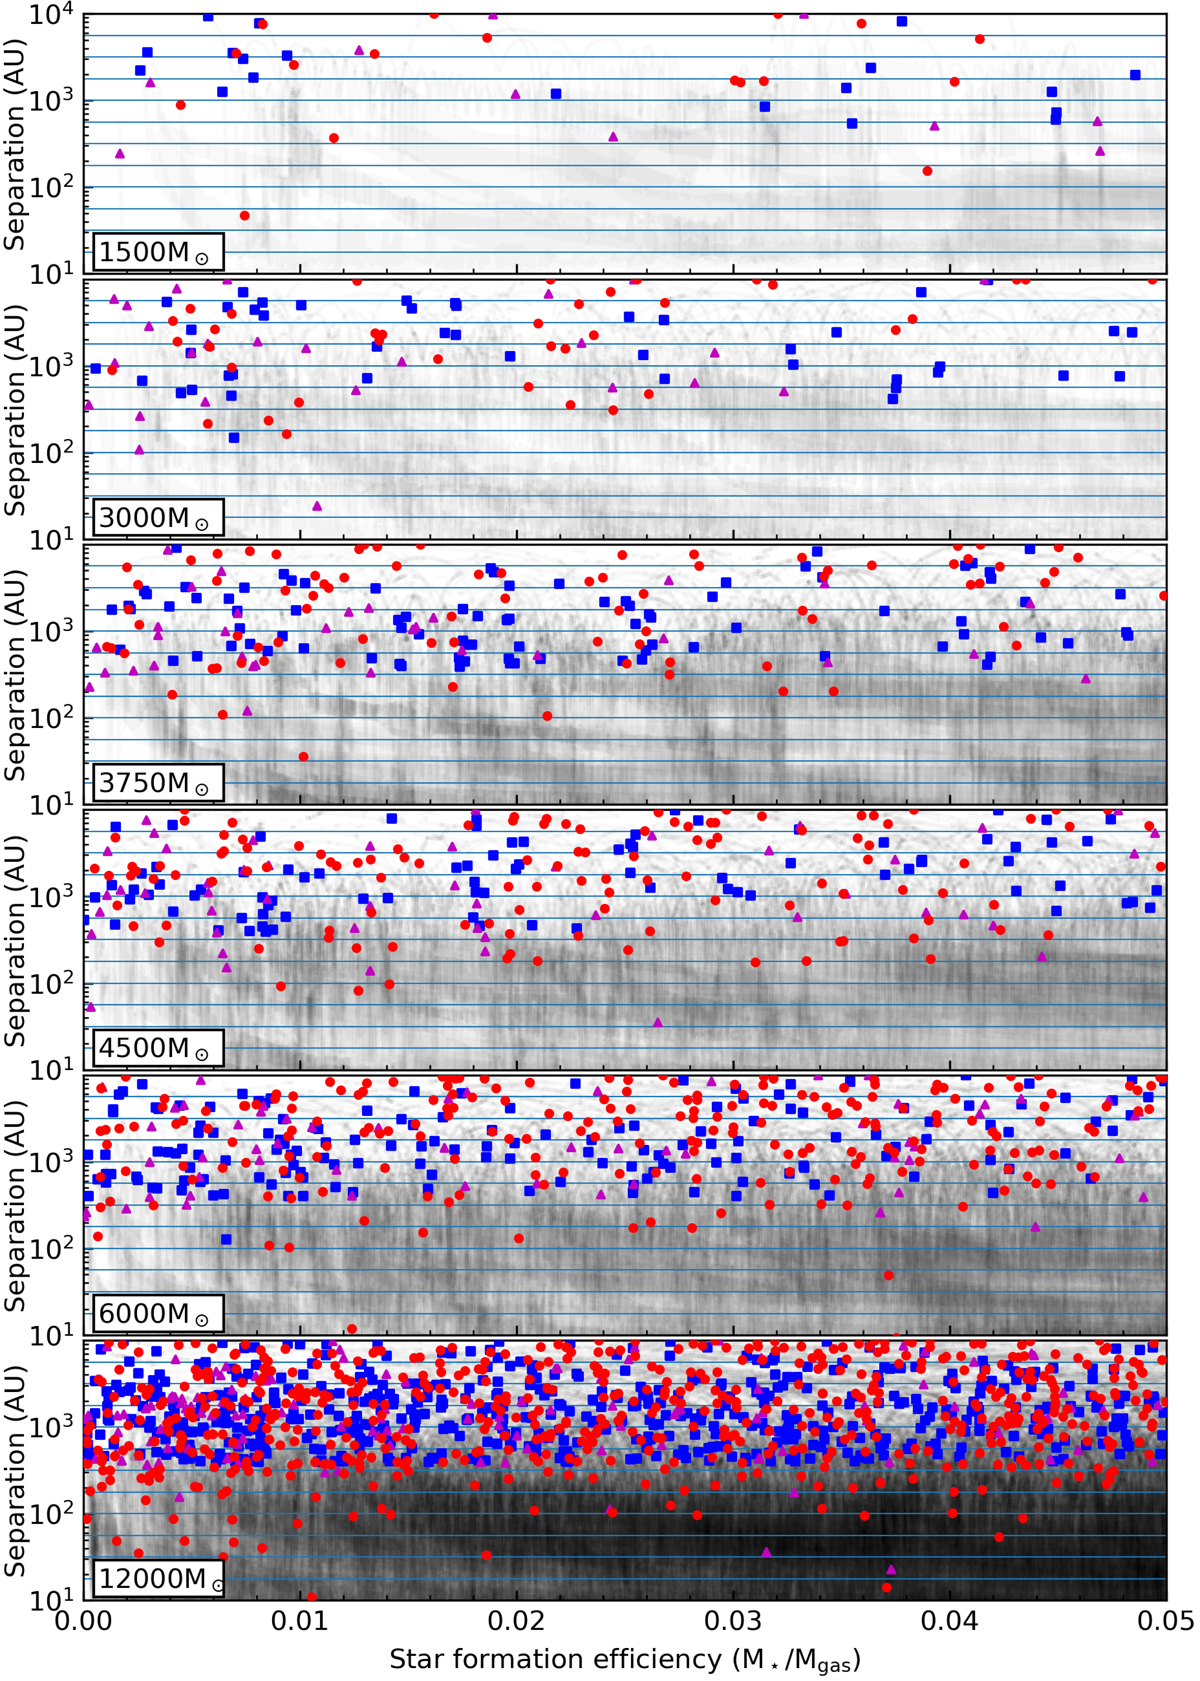
Separation vs. SFE of all systems formed in each simulation. The markers indicate the formation pathway of the system if it contains a new sink id. Blue boxes: bound core fragmentation, purple triangles: unbound core fragmentation, red circles: dynamical capture.
Current usage metrics show cumulative count of Article Views (full-text article views including HTML views, PDF and ePub downloads, according to the available data) and Abstracts Views on Vision4Press platform.
Data correspond to usage on the plateform after 2015. The current usage metrics is available 48-96 hours after online publication and is updated daily on week days.
Initial download of the metrics may take a while.