Open Access
Fig. 2.
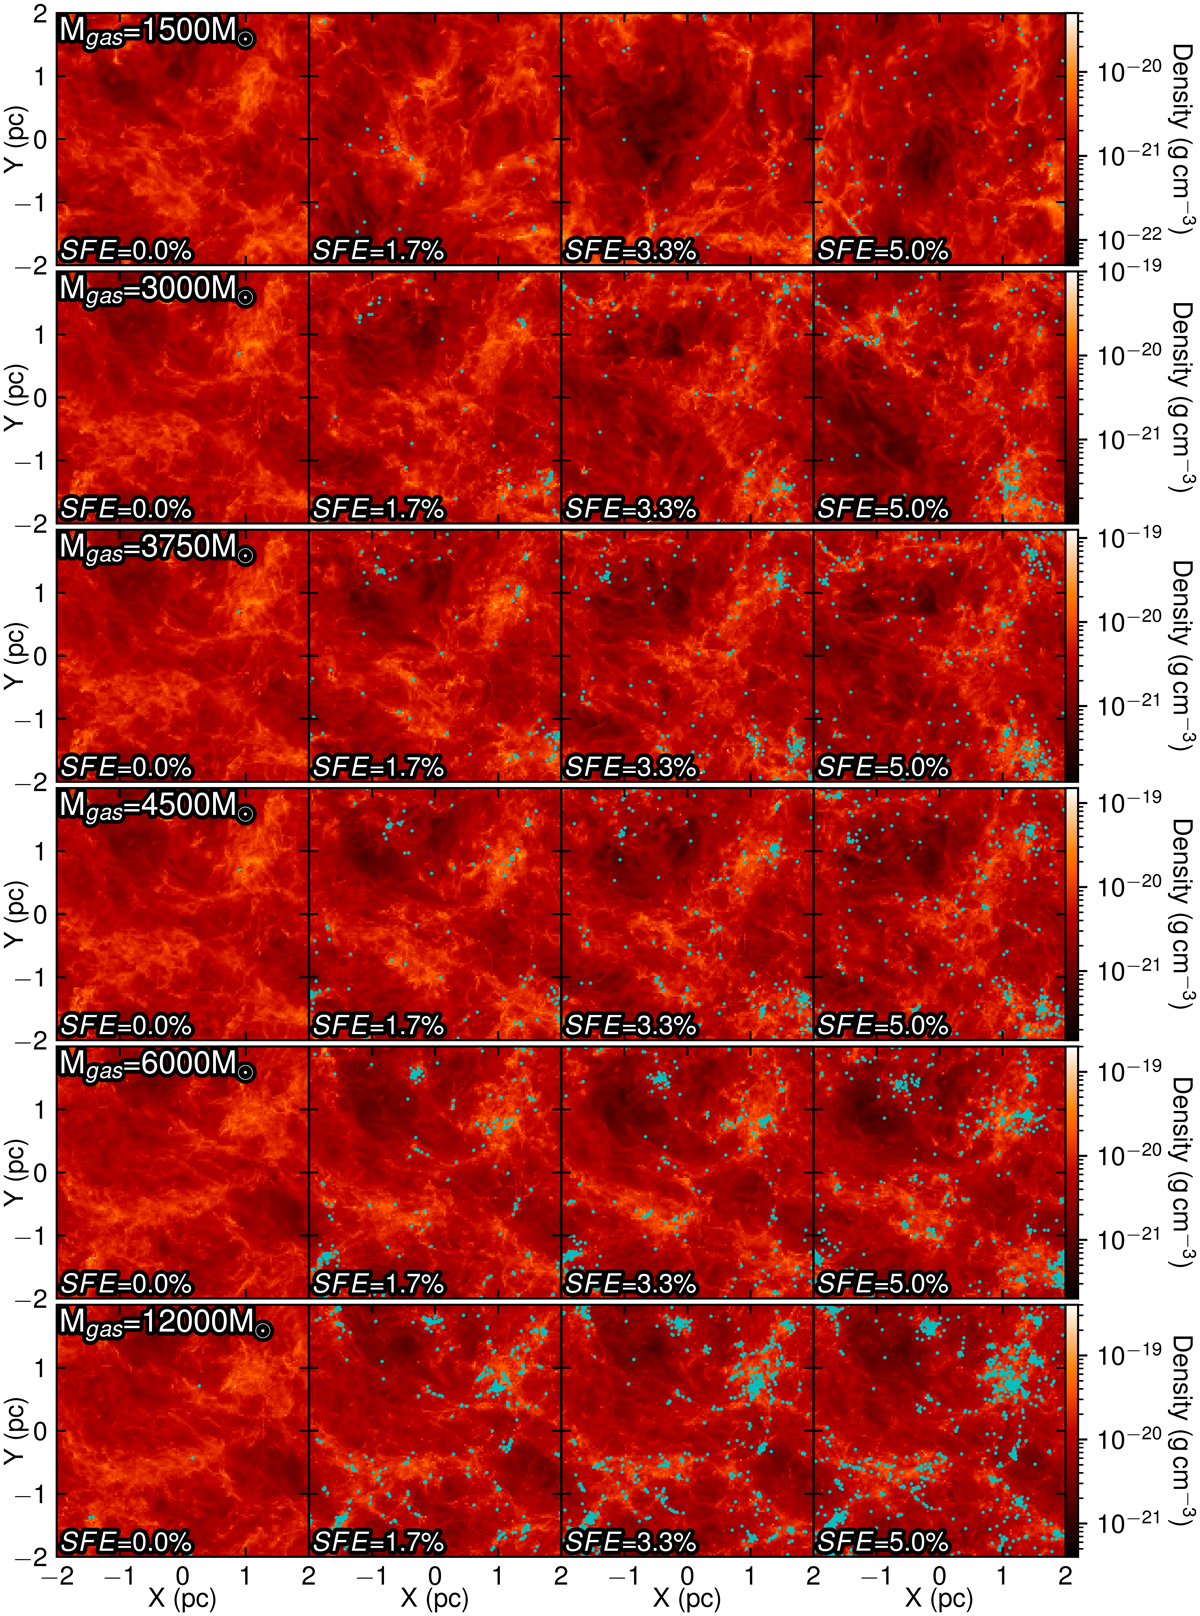
Download original image
Projections of the density over the entire computational domain from the formation of the first sink (left column) to SFE = 0.05 (right column), for each simulation. The sink particles are annotated with blue particles. The colour bars are logarithmically centred on the mean gas density of the initial gas distribution.
Current usage metrics show cumulative count of Article Views (full-text article views including HTML views, PDF and ePub downloads, according to the available data) and Abstracts Views on Vision4Press platform.
Data correspond to usage on the plateform after 2015. The current usage metrics is available 48-96 hours after online publication and is updated daily on week days.
Initial download of the metrics may take a while.