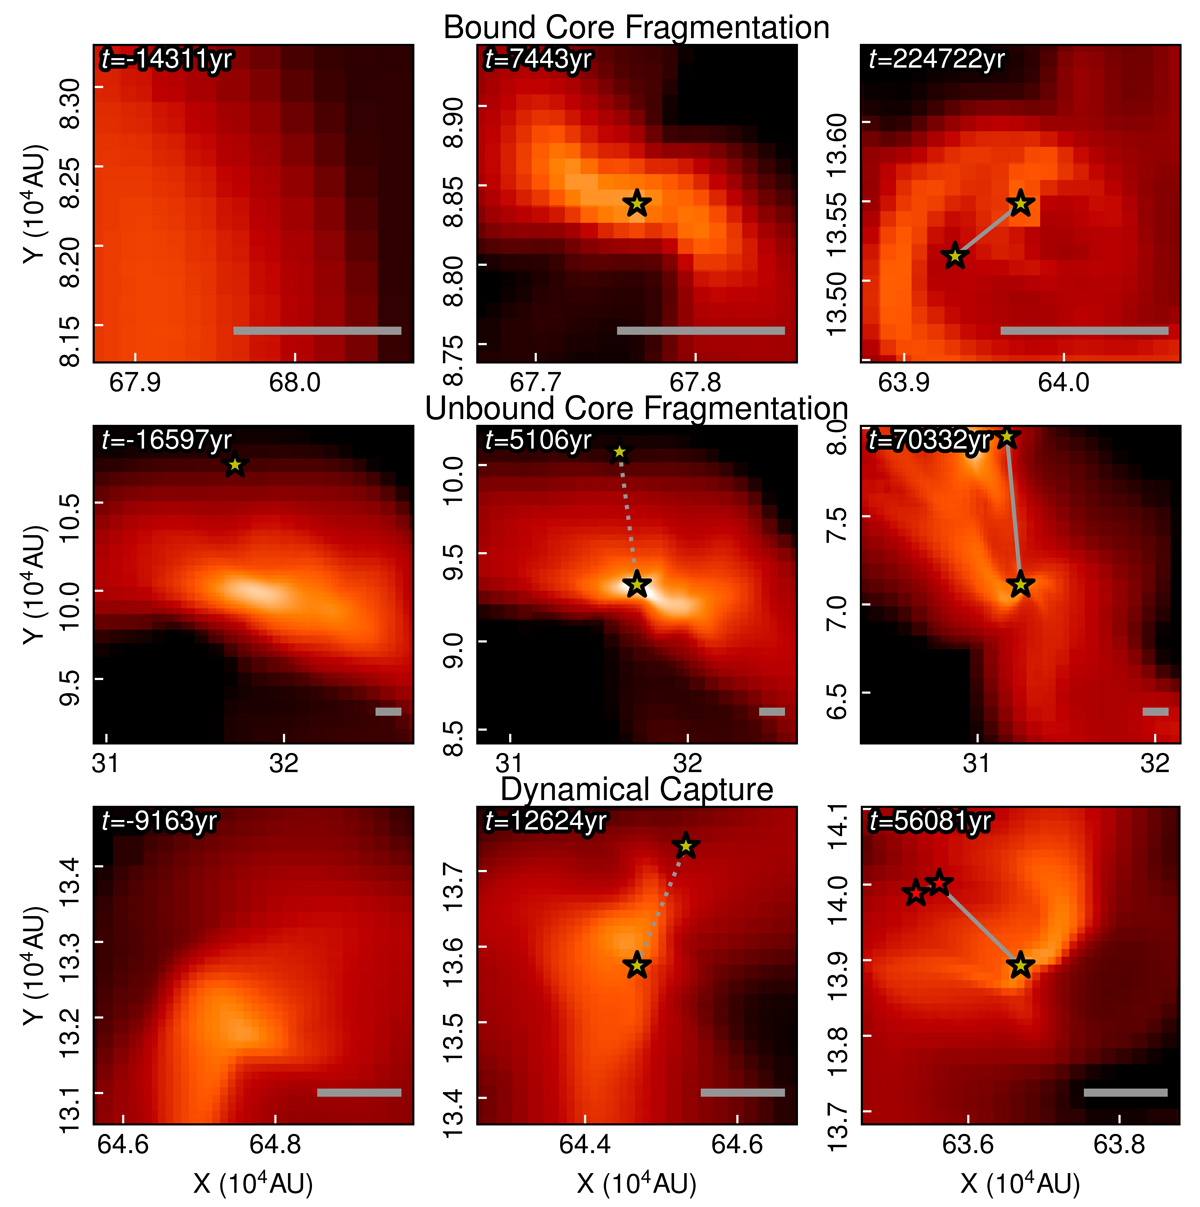
Fig. A.1.
Download original image
Shows examples of the formation pathways described in Figure 3 in Section 3.1. Projections were taken from candidates in the Mgas = 3000 M⊙ simulation. The grey bar in the bottom right of each panel annotates 1000 AU. The time annotated in the top left of each panel indicates the time with respect to the star that is centred on for each pathway.
Current usage metrics show cumulative count of Article Views (full-text article views including HTML views, PDF and ePub downloads, according to the available data) and Abstracts Views on Vision4Press platform.
Data correspond to usage on the plateform after 2015. The current usage metrics is available 48-96 hours after online publication and is updated daily on week days.
Initial download of the metrics may take a while.