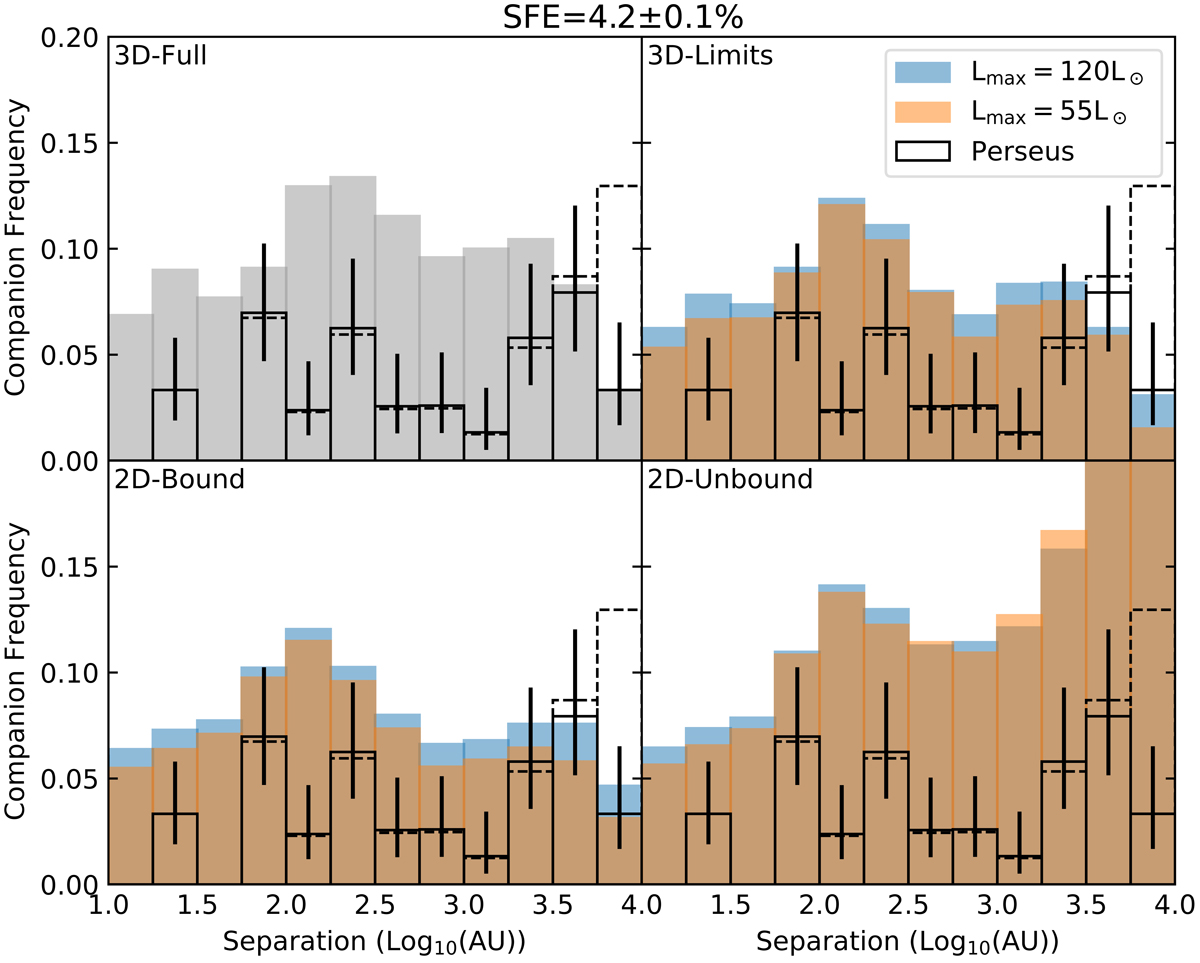
Fig. 13.
Download original image
Median companion frequency vs separation at star formation efficiency of 4.2%, averaged over an SFE ± 0.1% window, for the Mgas = 3750 M⊙ simulation. The solid histograms in each panel show the resulting CF vs. separation histogram for the different settings summarised in Table 2. For settings with the luminosity limits, the blue and orange show the results with an upper limit of 55 and 120 L⊙ respectively. The black dashed histogram shows the observed distribution found by Tobin et al. (2022) for all class 0/I objects, and the solid black line is the histogram derived from pairs with boundness likelihood > 0.68. The error bars are calculated using the binomial statistics described by Eq. (3) in Tobin et al. (2022).
Current usage metrics show cumulative count of Article Views (full-text article views including HTML views, PDF and ePub downloads, according to the available data) and Abstracts Views on Vision4Press platform.
Data correspond to usage on the plateform after 2015. The current usage metrics is available 48-96 hours after online publication and is updated daily on week days.
Initial download of the metrics may take a while.