Open Access
Fig. 11.
Download original image
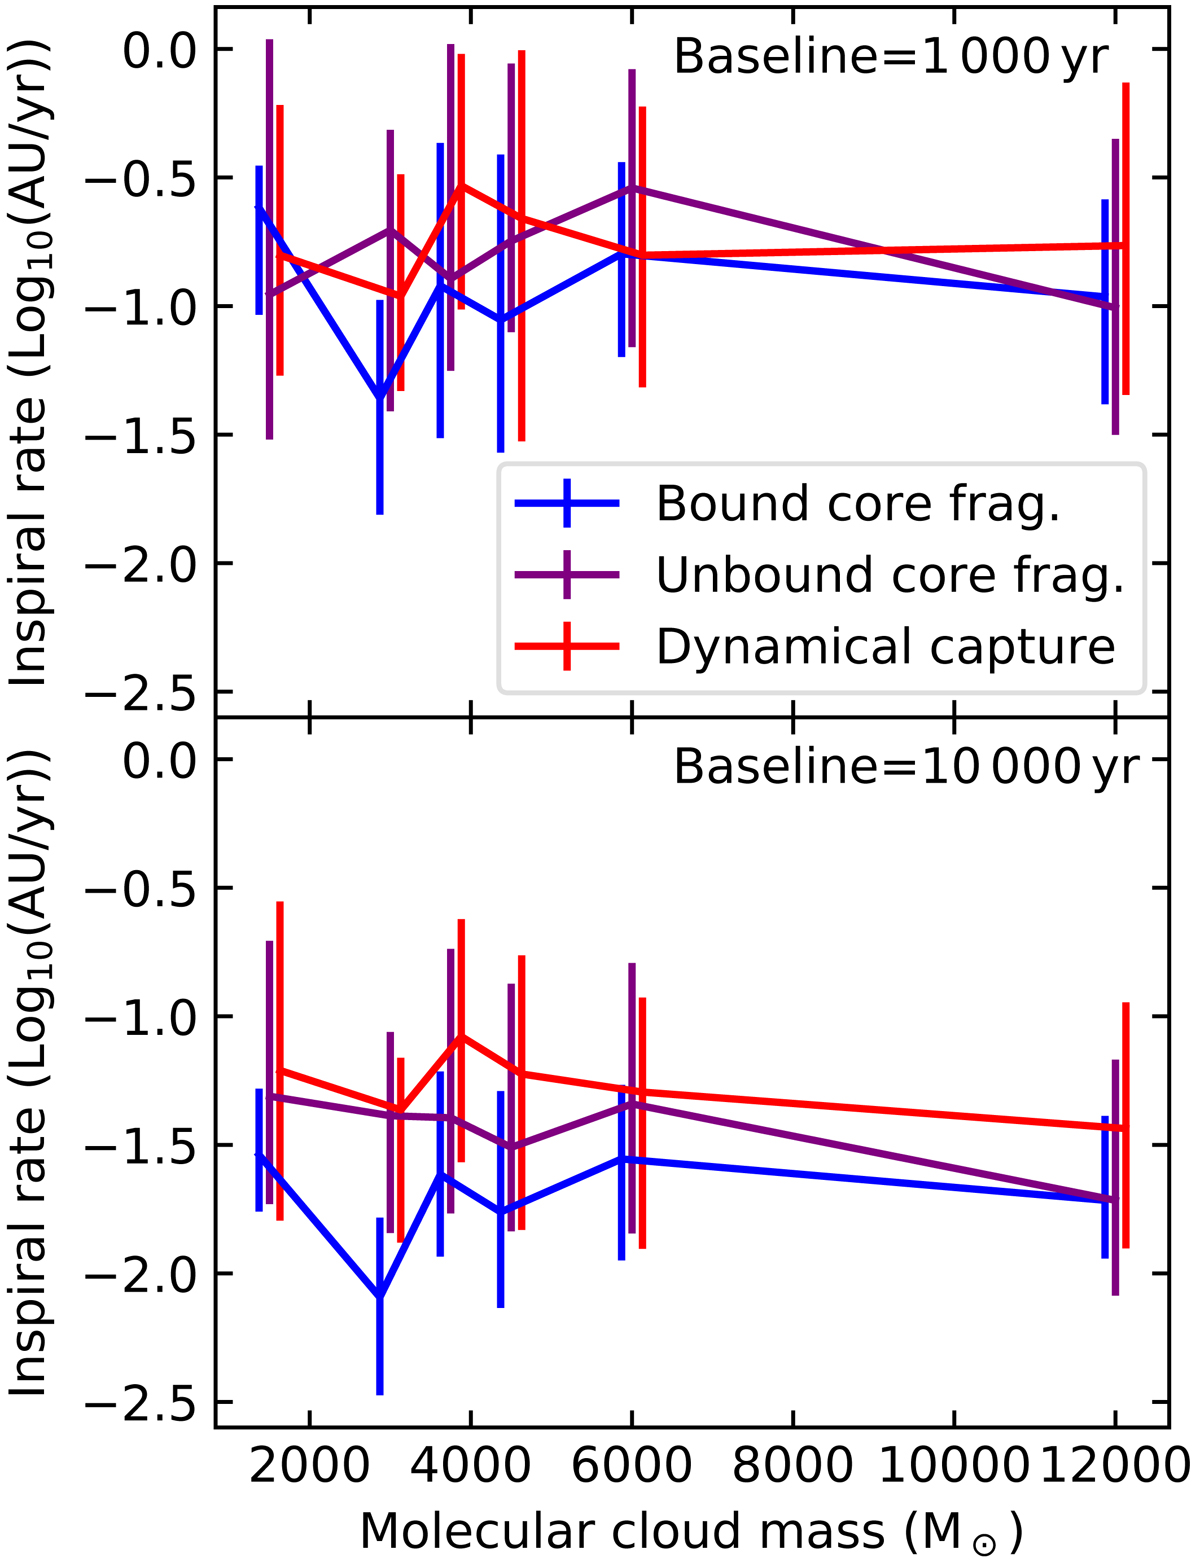
Median inspiral rate of systems that formed via the different formation pathways (see Fig. 3) measured over the 1000 yr (top) and 10 000 yr (bottom) after the first periastron of the system vs initial gas mass of each simulation. The error bars show the standard deviation of the measured inspiral rates.
Current usage metrics show cumulative count of Article Views (full-text article views including HTML views, PDF and ePub downloads, according to the available data) and Abstracts Views on Vision4Press platform.
Data correspond to usage on the plateform after 2015. The current usage metrics is available 48-96 hours after online publication and is updated daily on week days.
Initial download of the metrics may take a while.