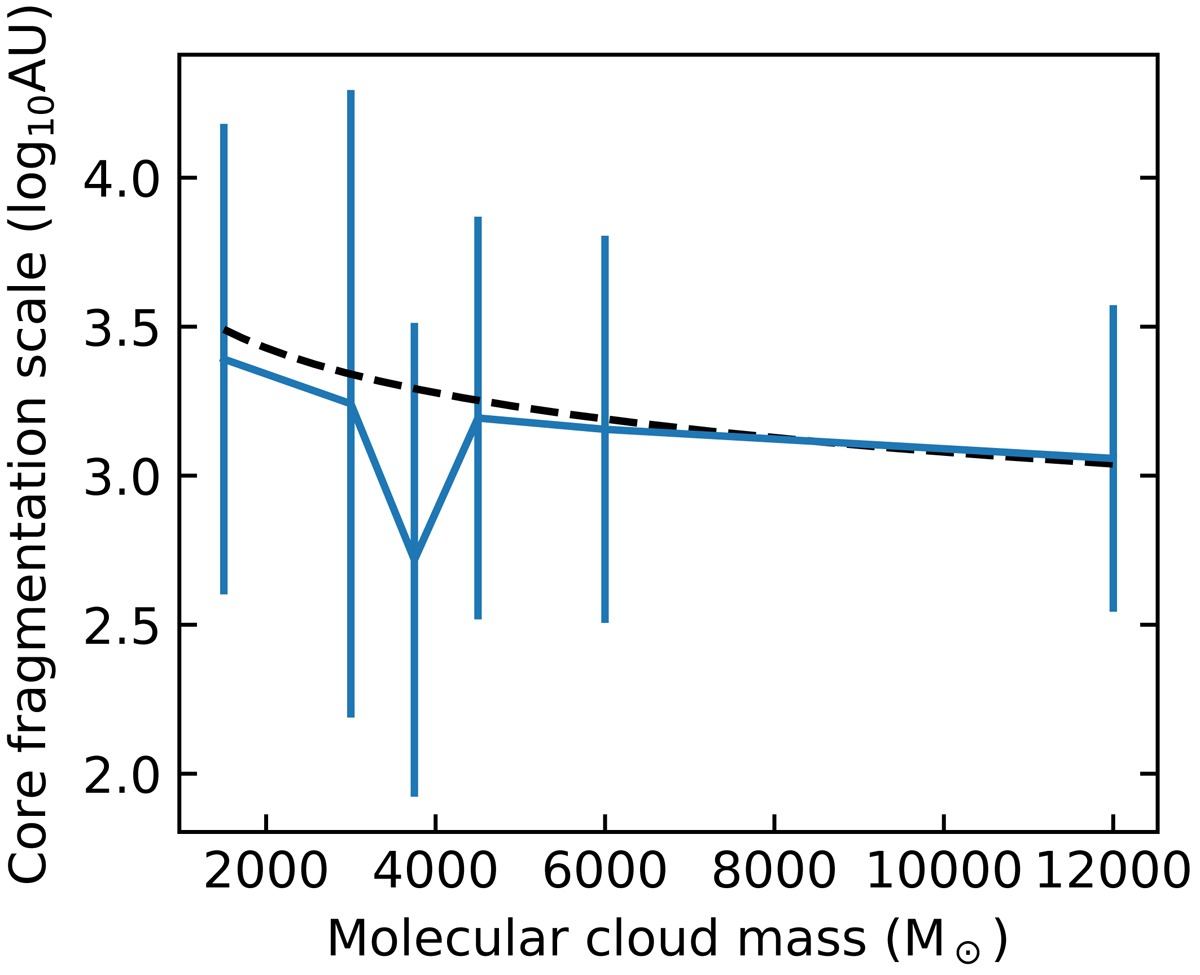
Fig. 10.
Download original image
Mean fragmentation scale as a function of the GMC mass. The curve shows the peak of Gaussian distributions fitted to the (stacked) histogram of initial separations of systems formed via core fragmentation pathways plotted in Fig. 9. The error bars are the width of the Gaussian distributions and not the error on the peaks. The dashed line shows the theoretical prediction from assuming that cores on average can be described as critical Bonnor-Ebert spheres.
Current usage metrics show cumulative count of Article Views (full-text article views including HTML views, PDF and ePub downloads, according to the available data) and Abstracts Views on Vision4Press platform.
Data correspond to usage on the plateform after 2015. The current usage metrics is available 48-96 hours after online publication and is updated daily on week days.
Initial download of the metrics may take a while.