Open Access
Fig. 5
Download original image
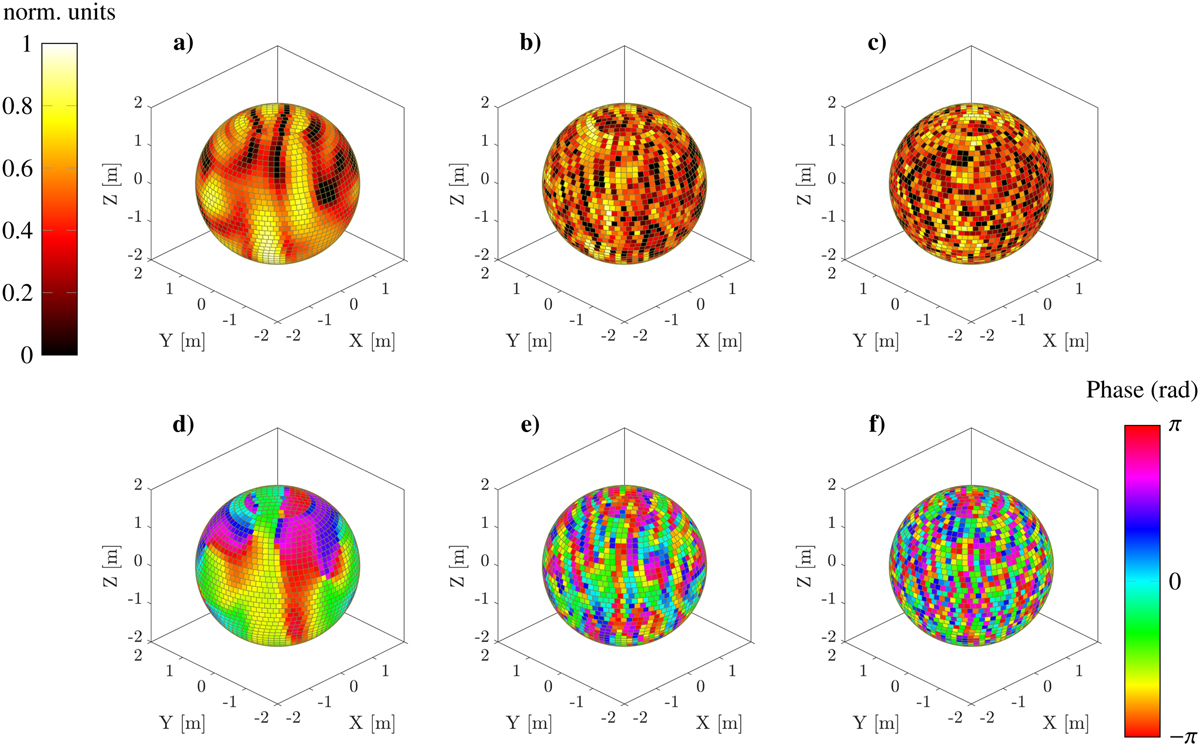
Spatial variations of the modulus (a–c) and phase (d–f) of the scattered electric field measured in the anechoic chamber, at f = 3.5 GHz (left), f = 10 GHz (centre), and f = 16 GHz (right). These values of the scattered field are plotted on the positions corresponding to the configuration in Fig. 4a.
Current usage metrics show cumulative count of Article Views (full-text article views including HTML views, PDF and ePub downloads, according to the available data) and Abstracts Views on Vision4Press platform.
Data correspond to usage on the plateform after 2015. The current usage metrics is available 48-96 hours after online publication and is updated daily on week days.
Initial download of the metrics may take a while.