| Issue |
A&A
Volume 691, November 2024
|
|
|---|---|---|
| Article Number | A110 | |
| Number of page(s) | 8 | |
| Section | Cosmology (including clusters of galaxies) | |
| DOI | https://doi.org/10.1051/0004-6361/202451643 | |
| Published online | 05 November 2024 | |
Implications of scattering for CMB foreground emission modelling
1
Department of Astronomy, School of Physical Sciences, University of Science and Technology of China,
96 Jinzhai Road,
Hefei,
Anhui
230026,
China
2
School of Astronomy and Space Science, University of Science and Technology of China,
96 Jinzhai Road,
Hefei,
Anhui
230026,
China
3
CAS Key Laboratory for Researches in Galaxies and Cosmology, University of Science and Technology of China,
96 Jinzhai Road,
Hefei,
Anhui
230026,
China
4
CNRS-UCB International Research Laboratory, Centre Pierre Binétruy,
IRL 2007, CPB-IN2P3,
Berkeley,
CA
94720,
USA
5
Lawrence Berkeley National Laboratory,
1 Cyclotron Road,
Berkeley,
CA
94720,
USA
6
Kavli IPMU (WPI), UTIAS, The University of Tokyo,
Kashiwa,
Chiba
277-8583,
Japan
★ Corresponding author; This email address is being protected from spambots. You need JavaScript enabled to view it.
; This email address is being protected from spambots. You need JavaScript enabled to view it.
Received:
24
July
2024
Accepted:
1
October
2024
Abstract
Context. The extreme precision and accuracy of forthcoming observations of the cosmic microwave background (CMB) temperature and polarisation anisotropies, aiming to detect the tiny signatures of primordial gravitational waves or of light relic particles beyond the standard three light neutrinos, requires commensurate precision in the modelling of foreground Galactic emission that contaminates CMB observations.
Aims. We evaluate the impact of second-order effects in Galactic foreground emission due to Thomson scattering off interstellar free electrons and to Rayleigh scattering off interstellar dust particles.
Methods. We used existing sky survey data and models of the distribution of free electrons and dust within the Milky Way to estimate the amplitude and power spectra of the emission originating from radiation scattered either by free electrons or by dust grains at CMB frequencies.
Results. Both processes generate corrections to the total emission that are small compared to direct emission and are small enough not to pose problems for current-generation observations.
Conclusions. However, B modes generated by Thomson scattering of incoming radiation off interstellar free electrons at CMB frequencies are within an order of magnitude compared to the sensitivity of the most advanced forthcoming CMB telescopes, and might require more precise evaluation in the future.
Key words: cosmic background radiation / cosmology: observations / inflation / radio continuum: ISM
© The Authors 2024
 Open Access article, published by EDP Sciences, under the terms of the Creative Commons Attribution License (https://creativecommons.org/licenses/by/4.0), which permits unrestricted use, distribution, and reproduction in any medium, provided the original work is properly cited.
This article is published in open access under the Subscribe to Open model. This email address is being protected from spambots. You need JavaScript enabled to view it. to support open access publication.
1 Introduction
Since the discovery of the cosmic microwave background (CMB) by Penzias and Wilson (Penzias & Wilson 1965), the CMB has emerged as a powerful cosmological probe, enabling deeper understanding of the history and evolution of our universe, as well as rigorous testing of cosmological models. The Wilkinson Microwave Anisotropy Probe (WMAP, Bennett et al. 2013) and Planck (Planck Collaboration I 2020) space missions have achieved remarkable precision in measuring the full-sky temperature anisotropies of the CMB, while also providing invaluable survey data concerning CMB polarisation modes. Still, much information can yet be extracted from more sensitive and accurate observations of the CMB. This motivates robust ongoing ground-based, balloon-borne, and space-borne observational programmes. Observations with experiments such as the POLARBEAR (Arnold et al. 2010), South Pole Telescope (SPT, Carlstrom et al. 2011), BICEP-Keck experiment (BICEP2 Collaboration 2014), Atacama Cosmology Telescope Polarimeter (ACTPol, Naess et al. 2014), and Cosmology Large Angular Scale Surveyor (CLASS, Dahal et al. 2020), among others, have gradually improved the accuracy and sensitivity of polarisation measurements over patches of the southern sky, paving the way for even more ambitious ground-based observations with Ali CMB Polarization Telescope (AliCPT, Salatino et al. 2020), the Simons Observatory (Ade et al. 2019), Cosmic Microwave Background Stage Four (CMB-S4, Abazajian et al. 2019), as well as with next-generation space missions such as Lite (Light) satellite for the study of B-mode polarization and Inflation from cosmic background Radiation Detection (LiteBIRD, LiteBIRD Collaboration 2023), Probe of Inflation and Cosmic Origins (PICO, Hanany et al. 2019), CORE (Delabrouille et al. 2018), Primordial Inflation Explorer (PIXIE, Kogut et al. 2016, 2024), Polarized Radiation Imaging and Spectroscopy Mission (PRISM, André et al. 2014), and CMB-Bhārat (Adak et al. 2022).
One of the key objectives of these experiments is the detection, in CMB polarisation patterns, of the tiny signature of primordial gravitational waves produced during a phase of cosmic inflation in the extremely early universe. These so-called primordial B modes of CMB polarisation are expected to be orders of magnitude fainter than polarised foreground emission from the Galactic interstellar medium (ISM), which has motivated numerous studies of the detectability of CMB B modes in the presence of foreground contamination (Tucci et al. 2005; Betoule et al. 2009; Dunkley et al. 2009; Stompor et al. 2016; Remazeilles et al. 2018; Thorne et al. 2019; Remazeilles et al. 2021; Aurlien et al. 2023; Zhang et al. 2024). However, the conclusion of those studies may depend on the reliability of the assumptions being made on the properties of the foreground emission, even if blind and semi-blind methods such as Spectral Matching Independent Component Analysis method (SMICA, Delabrouille et al. 2003; Cardoso et al. 2008) or variants of Internal Linear Combination methods (Eriksen et al. 2004; Delabrouille et al. 2009; Remazeilles et al. 2011) are less prone to modelling errors than methods that assume a parametric model such as Optimal Monte-carlo Markov chAiN Driven EstimatoR (COMMANDER, Eriksen et al. 2008; Galloway et al. 2023) and spectral parametric fits considered in recent studies for future surveys (Abazajian et al. 2022). Consistent results obtained with different methods can help identify potential modelling errors and give confidence in component separation pipelines (Leach et al. 2008; Planck Collaboration IV 2020).
It is generally assumed that two main components in the Galactic ISM contribute to the foreground polarisation emission for CMB observations. Synchrotron emission, generated by relativistic electrons spiralling in the Galactic magnetic field, is strongly polarised and dominates at low frequencies below v ≃80 GHz, while thermal dust emission from elongated dust grains, which dominates above v ≃ 80 GHz, is polarised by reason of grain alignment perpendicular to the Galactic magnetic field. Free-free emission from warm ionised medium, dust emission from spinning dust grains, and line emissions from atoms and molecules such as carbon monoxide, which significantly contribute to foreground emission in intensity, are usually assumed to be unpolarised or very little polarised, and thus to negligibly impact the measurement of CMB polarisation in low-foreground emission regions of the sky.
With ever more precise CMB observations, it becomes crucial to thoroughly examine the possible interactions between these components and their impact on the detailed properties of polarised foreground emission. In general, free electrons and Galactic dust grains can absorb or scatter incoming radiation, which may potentially generate distortions in the modelled electromagnetic spectra through second-order effects. For example, while primordial thermal free-free emission is unpolarised due to the isotropy of the random Coulomb collisions charged between particles, Ichiki (2014) points out that Thomson scattering by free electrons which generate the free-free emission will produce polarised photons. In another instance, free electrons responsible for free-free emission can also absorb synchrotron radiation at low frequencies, around 408 MHz, which may produce bias in the modelling of synchrotron radiation when extrapolated to higher frequency (Sun et al. 2008; Delabrouille et al. 2013). And also, dust particles absorb CMB photons, generating a ‘CMB shadow’ that generates an effective (negative) component of polarised emission by interstellar dust (Nashimoto et al. 2020).
In this paper, we investigate two more of these second-order effects while estimating their magnitudes and impacts for modelling foreground emission. Of specific interest are the scattering of dust and synchrotron emission by a distribution of thermal free electrons as well as the scattering of synchrotron and free-free emission by dust particles. Indeed, these second-order effects would generate apparent emission processes with frequency scaling different from that of the intrinsic emission of those scatterers.
The rest of this paper is organised as follows: In Sect. 2 we derived mathematical formulae and approximation for the scattering of Galactic emission by free electrons, along with corresponding numerical estimates of the scattering of incoming radiation for a recent model of free-electron distribution. Sect. 3 checked the amplitude of Rayleigh scattering caused by dust grains and we concluded in Sect. 4.
2 Thomson scattering off free electrons
Scattering of anisotropic radiation by free electrons generates polarised emission originating from the scatterers. This is the exact process that generates most of CMB polarisation at the surface of last scattering (Hu & White 1997). In our own Galaxy, free electrons are potential scatterers of incoming emission originating from the Milky Way. This generates a component of polarised emission associated with the warm ionised medium in the Galactic ISM.
2.1 Scattering model
The intensity and polarisation properties of an electromagnetic wave with frequency v propagating along direction n can be totally quantified with a rank-2 tensor, the ‘polarisation tensor’, denoted by Jv (Landau & Lifshitz 1980):
 (1)
(1)
where the complex vector Ev is the electric component of the electromagnetic wave and  is its complex conjugate. The triangular brackets indicate averaging over time. The factor before the triangular brackets, 2/µ0c, can be determined as follows: according to Poynting’s theorem, the intensity of radiation, dIv, into the infinitesimal solid angle element dΩ is
 (2)
(2)
where Sv, Bv, and Ev represent the Poynting vector (and also the energy flux density of the electromagnetic wave), in addition to electric and magnetic vectors with frequency v, at a distance r from the emission source, respectively. The factor 2 arises here due to the one-side Fourier transform in the range with positive frequency. Thus the trace of the polarisation tensor, that is, the intensity per unit area should be
 (3)
(3)
where the dot ‘·’ denotes the inner product between two vectors. For brevity, the subscript v denoting frequency will be omitted in the following. By selecting orthogonal unit vectors e1 and e2 perpendicular to the propagation direction n as the bases, the polarisation tensor can be written as
 (4)
(4)
where I, Q, U, and V are Stokes parameters corresponding to n.
Most free electrons in the Galactic ISM are in the form of warm ionised medium (WIM) and emit free-free emission that is essentially unpolarised (Dickinson et al. 2003; Macellari et al. 2011). Thomson scattering of incoming radiation by those free electrons, however, would generate additional apparent radiation originating from the WIM. The scattering of emission originating from our own Galaxy is of specific interest. Incoming anisotropic emission, which is strong parallel to the Galactic plane (particularly from the Galactic centre) and faint in the orthogonal direction, generates polarised scattered light. This scattered light has frequency scaling similar to that of the incoming total emission and is directed towards the observer from the regions of ionised bubbles. In this section, we estimate the magnitude and polarisation level of this scattered emission.
Free electrons, which are responsible for free-free emission in the Milky Way, exhibit a characteristic temperature of approximately 8000 K (Ferrière 2001). Their thermal velocities are tiny compared to the speed of light. As a result, the scattering of light by these electrons falls within the regime of Thomson scattering. The electric vector of the scattered light, E′, is related to both the incident light’s electric vector E and the direction of scattering n′ (with the prime ′ denoting scattered quantities hereafter) according to
![Mathematical equation: ${{\bf{E}}^\prime } = {{{\mu _0}{q^2}} \over {4\pi {m_{\rm{e}}}{r^\prime }}}{{\bf{n}}^\prime } \times \left( {{{\bf{n}}^\prime } \times {\bf{E}}} \right) = {{{\mu _0}{q^2}} \over {4\pi {m_{\rm{e}}}{r^\prime }}}\left[ {\left( {{{\bf{n}}^\prime } \cdot {\bf{E}}} \right){{\bf{n}}^\prime } - {\bf{E}}} \right],$](/articles/aa/full_html/2024/11/aa51643-24/aa51643-24-eq8.png) (5)
(5)
where r′ is the distance between the electron and the observer, me is the electron mass, and q = 1.602 × 10⁻¹⁹ C is the elementary charge. Then the polarisation characteristics of the scattered light are determined by the projection of its polarisation tensor onto the two base vectors  perpendicular to the scattering direction n′ (see Fig. 1):
 (6)
(6)
For CMB observations, we are mostly interested in foreground emission at high Galactic latitudes, which mainly originates from the vicinity of Earth in our Galaxy. Indeed, the number density of free electrons decays rapidly as they move away from the Galactic plane (Reynolds 1989). Thus it is mostly free electrons near Earth that produce most of the scattering in mid-high latitudes. For those free electrons, the integrated Galactic emission as a function of direction is similar to that observed on Earth. As a first approximation we can represent the incoming radiation with a single two-dimensional background map, identical for all scatterers and also identical to what is directly observed with telescopes on Earth or in orbit. This is, however, only an approximation, which may not hold in local regions of strong inhomogeneity of the local ISM and thus of the local incoming radiation. We just neglect this subtlety in the present work.
A free electron in the direction − n′, at a distance r′ from Earth, receives incident light from all directions and then scatters it towards all directions, particularly in direction n′, that is, towards us. Thus the component  of the scattered light by this single electron1, representing the result of the polarisation tensor of the scattered light operating on (i.e. being projected onto) the base vectors
  , should be
 (7)
(7)
where  is the Thomson scattering cross-section. The integration over solid angle dΩ is due to the fact that the electron scatters a fraction of the incident radiation E from all incoming directions and towards any specific direction (here, towards us).
Along a certain line of sight defined by the direction vector n′, we integrate over the infinitesimal volume element r′2dΩ‘dr′containing free electrons to obtain the scattered signal power per unit area, per unit solid angle, and per unit frequency interval measured on Earth,
 (8)
(8)
where DM(n′) ≡ ∫ Nedr′ is the dispersion measure of free electrons along direction n′ and Ne is the number density of free electrons. Due to the exponential decay of the number density of free electrons with distance from the Galactic plane, we make the approximation that the vast majority of scattering electrons at mid-high Galactic latitudes are concentrated close to Earth. Therefore, in Eq. (8), one can separate the integration over solid angle and the integration over distance along the line of sight.
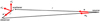 |
Fig. 1 Sketch depicting the relative positions of the emission source, scatterer, and observer. The unit direction vectors pointing from the source to the scatterer, from the scatterer to the observer, and from the source to the observer are represented by n, n′, and n0 respectively. The distance between the source and the scatterer is denoted as r, while r′ corresponds to the distance between the scatterer and the observer. Additionally, |


2.2 Numerical simulations
In this subsection, we turned to numerical estimations of scattered foreground emission from the ionised ISM as observable at millimetre wavelengths for CMB experiments, with an emphasis on emission from high Galactic latitudes. Although a complete and accurate calculation of the scattered light requires a complete three-dimensional model of the distribution of the free electrons and of radiation at all positions, a simplified model can give an estimation of the amplitude and polarisation of the scattered emission.
According to Eq. (8), this estimation requires both a template for incoming radiation and the dispersion measure of free electrons. The Planck space mission (Planck Collaboration I 2020) publishes comprehensive full-sky emission maps that can be used as templates for the incoming radiation in a set of frequency bands of interest. The dispersion measure of free electrons over the full-sky, however, is not very well known. It is measured through the dispersion of the arrival time of electromagnetic pulses emitted by pulsars as they traverse electron-rich regions (Taylor & Cordes 1993). Hutschenreuter et al. (2024) obtains a full-sky map of Galactic electron dispersion measure using pulsar dispersion measures (DMs) from the Australia Telescope National Facility catalogue (Manchester et al. 2005), extragalactic Faraday rotation measures (RMs) from Van Eck et al. (2023), emission measure (EM) map of Galactic electrons from Planck Collaboration X (2016), H-α emission map from Finkbeiner (2003), and the three-dimensional distribution model of Galactic electrons by Yao et al. (2017, hereafter YMW16). The YMW16 three-dimensional model for thermal electron distribution only accounts for the largest-scale distribution and a few local structures, in particular the Gum Nebula and Local Cavity. The DM map from Hutschenreuter et al. (2024)2, shown in Fig. 2, however, comprises smaller-scale fluctuations of electron number density. The angular power spectrum corresponding to the projection of these perturbations on the two-dimensional celestial sphere is compatible with the predictions based on the log-normal distribution for density perturbations following a Kolmogorov power spectrum in three-dimensional space (Chepurnov & Lazarian 2010; Petroff et al. 2013; Hutschenreuter et al. 2024):
 (9)
(9)
Although Hutschenreuter et al. (2024) points out that the DMs in the inner disk may be under-estimated by a factor of about two and also marginally underrated at high latitudes, we opted to use their DM map to estimate the order of magnitude of the signal originating from scattering by free electrons, with a specific interest in regions at mid to high Galactic latitudes. We modelled incident radiation at the scatterers using Planck observations with the CMB subtracted3.
Fig. 3 displays the resulting Stokes parameters and polarisation degree  of scattered foreground emission by interstellar electrons, for three different frequencies of interest. Unsurprisingly, the overall intensity of the emission closely follows the DM map that was used for this calculation. This is due to the approximation that each scattering electron ‘sees’ the same incoming radiation pattern. Away from the Galactic plane, the total amplitude of the scattered light is in the tens of nK range at 100 GHz, while polarised intensity is of a few nK. The polarisation is dominated by the Q Stokes parameter for obvious geometrical reasons: incoming radiation mostly arrives at the scatterers parallel to the Galactic plane, hence the scattered emission is polarised perpendicularly to the Galactic plane. The polarisation degree reaches tens of percents at Galactic longitudes of 90 and 270 degrees, perpendicular to the direction of Galactic centre, where the incident foreground is the strongest.
We are particularly interested in the angular power spectra of scattered light in regions with low foreground emission, that is, at medium and high Galactic latitudes. We computed power spectra using two masks, displayed in the leftmost column of Fig. 4:
 (10)
(10)
and
 (11)
(11)
Fig. 4 shows the comparison of the scattered Galactic foreground emission by free electrons, with scalar mode CMB, primordial tensor mode CMB with r = 0.0001 and 0.001, synchrotron4, and thermal dust foreground emission5. Although scattering of foreground is a small secondary effect, it is not completely negligible relative to primordial tensor mode CMB signals for r values of the order of 0.001 or less. We noted that even at higher latitudes, as displayed in the bottom part of Fig. 4, this effect is still worth considering to some extent.
Free electrons in our own Galaxy also scatter the CMB photons themselves, generating polarised emission by scattering the primordial CMB quadrupole off Galactic electrons. This effect, however, generates a contribution to sky emission that turns out to be very small and can be safely ignored.
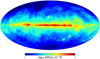 |
Fig. 2 Dispersion measure of Galactic electrons in logarithmic colour mapping, from Hutschenreuter et al. (2024). |
3 Rayleigh scattering by ISM dust grains
This section estimated the amplitude of scattering emission off dust grains in the ISM. The particle size distributions within ISM can be approximated by power-law functions, as outlined by the model presented in Mathis et al. (1977):
 (12)
(12)
where for graphite particles, 0.005 µm < a < 1 µm; and for other materials, 0.025 µm < a < 0.25 µm. Specific constants 𝒜X correspond to different materials: 𝒜Si = 10−25.10 cm2.5 and 𝒜C = 10−25.13 cm2.5 (Draine & Lee 1984). Here, NH represents the number density of hydrogen nuclei encompassing both atomic and molecular forms (Weingartner & Draine 2001), and accordingly, dNx is the number density of dust grains made of material ‘x’, sized between a and a + da. However, it should be noted that determining the precise number of large and small particles encounters challenges currently: large particles, characterised by a size a > λ (λ for visible and infrared bands), extinguish stellar light with negligible frequency dependence, which is known as ‘grey extinction’. Since most methods for measuring dust extinction are related to reddening rather than direct extinction, they exhibit insensitivity to grey extinction (Gorbikov & Brosch 2010). In the latter case, the dust particles reside in the Rayleigh limit of the visible light band, resulting in an extinction cross-section that is proportional to the volume of the particles. Consequently, the extinction cross-section per unit mass remains size-independent, making it difficult to determine the size distribution of these smallest particles through extinction measurements (Mathis et al. 1977).
CMB observations mostly occur in the millimetre to centimetre wavelength range (30 GHz to 300 GHz), for which the size of dust grains a smaller than 1/10λ. This leads to Rayleigh scattering dominating the scattering interaction of CMB foreground emission with ISM dust. Though dust particles within ISM usually exhibit aspherical shapes (Lazarian 2007), it is reasonable to perform an order of magnitude estimate by modelling them as uniform isotropic dielectric spheres with radius a and relative permittivity єr = Re{єr} + i lm{єr}, where the imaginary component of the permittivity contributes to the dissipation of electromagnetic waves in dielectric materials. For naturally occurring dissipative media, Im{єr} < 06. The absorption crosssection for a single uniform isotropic dielectric sphere with volume V is expressed as (Nordebo et al. 2019):
 (14)
(14)
and the total scattering cross-section across all directions is described by Jackson (1999):
 (15)
(15)
Similarly to the Thomson scattering case discussed in Sect. 2, with the distinction that the Rayleigh scattering crosssection depends on the incident wave’s frequency, the polarisation tensor of scattered light off single dust particle can be written as:
 (16)
(16)
Thus the total scattered light by all dust particles along one sightline is:
 (17)
(17)
The dust responsible for interstellar extinction appears to be relatively well-mixed with the gas in the Milky Way (Draine 2010). A well-established value exists for the mean ratio of total neutral hydrogen ΣH to colour excess (Bohlin et al. 1978), given by:
 (18)
(18)
Lines of sight traversing diffuse gas in the Milky Way tend to have an average value of  (Draine 2010). For RV = 3.1, a connection can be established between the column density of hydrogen atoms and dust extinction at V band, AV:
 (19)
(19)
Consequently, Eq. (17) can be related to the dust extinction data at V band, yielding:
 (20)
(20)
where
 (21)
(21)
With v = 100 GHz and AV ≃ 10 mag, the ratio is approximately 10−12. This implies that only about 10−12 of the incident foreground emission will be scattered by ISM dust. Fig. 5 shows the amplitude of the scattered foreground by interstellar dust at 143 GHz. Therefore, it is reasonable to conclude that the scattering effect from ISM dust can be ignored in the analysis of the CMB foreground emission.
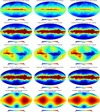 |
Fig. 3 Scattered foreground radiation by Galactic free electrons. From top to bottom: Stokes parameters I, Q, U, intensities of the polarisation mode, and polarisation degrees, in unit of µKCMB , except that the dimension of polarisation degree is unit-less. From left to right: maps at 30 GHz, 100 GHz, and 353 GHz. The maps use logarithmic colour mapping for the temperature mode and linear colour mapping for the others. |
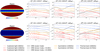 |
Fig. 4 Angular power spectra |

4 Conclusion
This paper addresses the computation of second-order effects in Galactic ISM emission arising from electric dipole scattering within the ISM on the CMB foreground signals, which encompass both Rayleigh scattering by dust grains and Thomson scattering by thermal free electrons within ionised regions. The impact of scattering by interstellar dust particles on foreground signals is a relative correction of the order of 10−12. Consequently, the contribution of Rayleigh scattering can be safely disregarded in the analysis of CMB foreground contamination.
Thomson scattering by free electrons, while still faint, is not obviously completely negligible for the most sensitive upcoming CMB experiments. This is due to the higher number density of interstellar free electrons as scatterers, the extreme sensitivity required for the detection of CMB polarisation signals corresponding to the primordial tensor perturbations, and the high degree of polarisation of scattered radiation. It might be worth to refine our estimate in the future and possibly take the scattering of foreground emission by free electrons in the Milky Way into account in the next generation of CMB telescope programmes aimed at searching for the trace of primordial gravitational waves.
The spectral energy distribution of the scattered Galactic foreground emission by free electrons is identical to that of the incident emission and its spatial distribution is highly correlated with free-free emission. Another key point is that the foreground emission scattered by free electrons is polarised, but free-free emission itself is not. One may try to detect the scattered emission by searching Q-type polarisation with a mean ISM emission spectrum in mid to high Galactic latitudes regions of ionised ISM.
We point out that the uncertainty of the work involved in this paper mainly comes from the spatial distribution of free electrons within the Milky Way, which is not very well measured as of now. However, based on the DM map from Hutschenreuter et al. (2024), we could get a first-order estimate of the magnitude of the scattering effect, which may be refined in the future. Our assumption that electrons as scatterers are all much closer to Earth than sources of incident foreground signals is another source of uncertainty. Theoretically, a full three-dimensional model of the distribution of matter within the Milky Way would be necessary to refine our calculations in future studies.
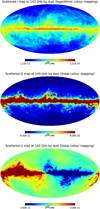 |
Fig. 5 Maps for Stokes parameters of the scattered foreground by dust particles, at 143 GHz. From top to bottom: Stokes I, Q, and U. |
Acknowledgements
We thank Brandon Hensley, Chang Feng, Václav Vavryčuk, Ya-Qi Zhao, and Rui Shi for helpful discussions and suggestions. This work is supported in part by National Key R&D Program of China (2021YFC2203100), by NSFC (12261131497), by CAS young interdisciplinary innovation team (JCTD-2022-20), by 111 Project (B23042), by Fundamental Research Funds for Central Universities, by CSC Innovation Talent Funds, by USTC Fellowship for International Cooperation, and by USTC Research Funds of the Double First-Class Initiative. Kavli IPMU is supported by World Premier International Research Center Initiative (WPI), MEXT, Japan. All numerical calculations were operated on the computer clusters LINDA & JUDY in the particle cosmology group at USTC.
References
- Abazajian, K., Addison, G., Adshead, P., et al. 2019, arXiv e-prints [arXiv:1907.04473] [Google Scholar]
- Abazajian, K., Addison, G. E., Adshead, P., et al. 2022, ApJ, 926, 54 [CrossRef] [Google Scholar]
- Adak, D., Sen, A., Basak, S., et al. 2022, MNRAS, 514, 3002 [NASA ADS] [CrossRef] [Google Scholar]
- Ade, P., Aguirre, J., Ahmed, Z., et al. 2019, J. Cosmology Astropart. Phys., 2019, 056 [CrossRef] [Google Scholar]
- André, P., Baccigalupi, C., Banday, A., et al. 2014, J. Cosmology Astropart. Phys., 2014, 006 [CrossRef] [Google Scholar]
- Arnold, K., Ade, P. A. R., Anthony, A. E., et al. 2010, SPIE Conf. Ser., 7741, 77411E [NASA ADS] [Google Scholar]
- Aurlien, R., Remazeilles, M., Belkner, S., et al. 2023, J. Cosmology Astropart. Phys., 2023, 034 [CrossRef] [Google Scholar]
- Bennett, C. L., Larson, D., Weiland, J. L., et al. 2013, ApJS, 208, 20 [Google Scholar]
- Betoule, M., Pierpaoli, E., Delabrouille, J., Le Jeune, M., & Cardoso, J. F. 2009, A&A, 503, 691 [NASA ADS] [CrossRef] [EDP Sciences] [Google Scholar]
- BICEP2 Collaboration. (Ade, P. A. R., et al.) 2014, Phys. Rev. Lett., 112, 241101 [NASA ADS] [CrossRef] [Google Scholar]
- Bohlin, R. C., Savage, B. D., & Drake, J. F. 1978, ApJ, 224, 132 [Google Scholar]
- Cardoso, J.-F., Le Jeune, M., Delabrouille, J., Betoule, M., & Patanchon, G. 2008, IEEE J. Sel. Top. Signal Process., 2, 735 [CrossRef] [Google Scholar]
- Carlstrom, J. E., Ade, P. A. R., Aird, K. A., et al. 2011, PASP, 123, 568 [CrossRef] [Google Scholar]
- Chepurnov, A., & Lazarian, A. 2010, ApJ, 710, 853 [NASA ADS] [CrossRef] [Google Scholar]
- Dahal, S., Amiri, M., Appel, J. W., et al. 2020, J. Low Temp. Phys., 199, 289 [NASA ADS] [CrossRef] [Google Scholar]
- Delabrouille, J. 2024, A&A, 689, A353 [NASA ADS] [CrossRef] [EDP Sciences] [Google Scholar]
- Delabrouille, J., Cardoso, J. F., & Patanchon, G. 2003, MNRAS, 346, 1089 [NASA ADS] [CrossRef] [Google Scholar]
- Delabrouille, J., Cardoso, J. F., Le Jeune, M., et al. 2009, A&A, 493, 835 [NASA ADS] [CrossRef] [EDP Sciences] [Google Scholar]
- Delabrouille, J., Betoule, M., Melin, J.-B., et al. 2013, A&A, 553, A96 [NASA ADS] [CrossRef] [EDP Sciences] [Google Scholar]
- Delabrouille, J., de Bernardis, P., Bouchet, F. R., et al. 2018, J. Cosmology Astropart. Phys., 2018, 014 [CrossRef] [Google Scholar]
- Dickinson, C., Davies, R. D., & Davis, R. J. 2003, MNRAS, 341, 369 [NASA ADS] [CrossRef] [Google Scholar]
- Draine, B. 2010, Physics of the Interstellar and Intergalactic Medium, Princeton Series in Astrophysics (Princeton University Press) [CrossRef] [Google Scholar]
- Draine, B. T., & Lee, H. M. 1984, ApJ, 285, 89 [NASA ADS] [CrossRef] [Google Scholar]
- Dunkley, J., Amblard, A., Baccigalupi, C., et al. 2009, in American Institute of Physics Conference Series, 1141, CMB Polarization Workshop: Theory and Foregrounds: CMBPol Mission Concept Study, eds. S. Dodelson, D. Baumann, A. Cooray, et al. (AIP), 222 [NASA ADS] [Google Scholar]
- Eriksen, H. K., Banday, A. J., Górski, K. M., & Lilje, P. B. 2004, ApJ, 612, 633 [Google Scholar]
- Eriksen, H. K., Jewell, J. B., Dickinson, C., et al. 2008, ApJ, 676, 10 [Google Scholar]
- Ferrière, K. M. 2001, Rev. Mod. Phys., 73, 1031 [NASA ADS] [CrossRef] [Google Scholar]
- Finkbeiner, D. P. 2003, ApJS, 146, 407 [Google Scholar]
- Galloway, M., Andersen, K. J., Aurlien, R., et al. 2023, A&A, 675, A3 [NASA ADS] [CrossRef] [EDP Sciences] [Google Scholar]
- Gorbikov, E., & Brosch, N. 2010, MNRAS, 401, 231 [NASA ADS] [CrossRef] [Google Scholar]
- Hanany, S., Alvarez, M., Artis, E., et al. 2019, arXiv e-prints [arXiv:1902.10541] [Google Scholar]
- Hu, W., & White, M. 1997, New A, 2, 323 [NASA ADS] [CrossRef] [Google Scholar]
- Hutschenreuter, S., Haverkorn, M., Frank, P., Raycheva, N. C., & Enßlin, T. A. 2024, A&A, 690, A314 [NASA ADS] [CrossRef] [EDP Sciences] [Google Scholar]
- Ichiki, K. 2014, Prog. Theor. Exp. Phys., 2014, 06B109 [CrossRef] [Google Scholar]
- Jackson, J. D. 1999, Classical Electrodynamics, 3rd edn. (New York, NY: Wiley) [Google Scholar]
- Kogut, A., Chluba, J., Fixsen, D. J., Meyer, S., & Spergel, D. 2016, SPIE Conf. Ser. 9904, 99040W [NASA ADS] [Google Scholar]
- Kogut, A., Switzer, E., Fixsen, D., et al. 2024, arXiv e-prints [arXiv:2405.20403] [Google Scholar]
- Landau, L. D., & Lifshitz, E. M. 1980, Course of Theoretical Physics, 2, The Classical Theory of Fields (Elsevier Science) [Google Scholar]
- Lazarian, A. 2007, J. Quant. Spec. Radiat. Transf., 106, 225 [NASA ADS] [CrossRef] [Google Scholar]
- Leach, S. M., Cardoso, J. F., Baccigalupi, C., et al. 2008, A&A, 491, 597 [NASA ADS] [CrossRef] [EDP Sciences] [Google Scholar]
- LiteBIRD Collaboration (Allys, E., et al.) 2023, Prog. Theor. Exp. Phys., 2023, 042F01 [CrossRef] [Google Scholar]
- Macellari, N., Pierpaoli, E., Dickinson, C., & Vaillancourt, J. E. 2011, MNRAS, 418, 888 [NASA ADS] [CrossRef] [Google Scholar]
- Manchester, R. N., Hobbs, G. B., Teoh, A., & Hobbs, M. 2005, AJ, 129, 1993 [Google Scholar]
- Mathis, J. S., Rumpl, W., & Nordsieck, K. H. 1977, ApJ, 217, 425 [Google Scholar]
- Naess, S., Hasselfield, M., McMahon, J., et al. 2014, J. Cosmology Astropart. Phys., 2014, 007 [NASA ADS] [CrossRef] [Google Scholar]
- Nashimoto, M., Hattori, M., & Chinone, Y. 2020, ApJ, 895, L21 [NASA ADS] [CrossRef] [Google Scholar]
- Nordebo, S., Mirmoosa, M., & Tretyakov, S. 2019, J. Appl. Phys., 125, 103105 [NASA ADS] [CrossRef] [Google Scholar]
- Penzias, A. A., & Wilson, R. W. 1965, ApJ, 142, 419 [CrossRef] [Google Scholar]
- Petroff, E., Keith, M. J., Johnston, S., van Straten, W., & Shannon, R. M. 2013, MNRAS, 435, 1610 [CrossRef] [Google Scholar]
- Planck Collaboration X. 2016, A&A, 594, A10 [NASA ADS] [CrossRef] [EDP Sciences] [Google Scholar]
- Planck Collaboration I. 2020, A&A, 641, A1 [NASA ADS] [CrossRef] [EDP Sciences] [Google Scholar]
- Planck Collaboration IV. 2020, A&A, 641, A4 [NASA ADS] [CrossRef] [EDP Sciences] [Google Scholar]
- Remazeilles, M., Delabrouille, J., & Cardoso, J.-F. 2011, MNRAS, 410, 2481 [Google Scholar]
- Remazeilles, M., Banday, A. J., Baccigalupi, C., et al. 2018, J. Cosmology Astropart. Phys., 2018, 023 [CrossRef] [Google Scholar]
- Remazeilles, M., Rotti, A., & Chluba, J. 2021, MNRAS, 503, 2478 [NASA ADS] [CrossRef] [Google Scholar]
- Reynolds, R. J. 1989, ApJ, 339, L29 [NASA ADS] [CrossRef] [Google Scholar]
- Salatino, M., Austermann, J., Thompson, K. L., et al. 2020, SPIE Conf. Ser., 11453, 114532A [Google Scholar]
- Stompor, R., Errard, J., & Poletti, D. 2016, Phys. Rev. D, 94, 083526 [NASA ADS] [CrossRef] [Google Scholar]
- Sun, X. H., Reich, W., Waelkens, A., & Enßlin, T. A. 2008, A&A, 477, 573 [NASA ADS] [CrossRef] [EDP Sciences] [Google Scholar]
- Taylor, J. H., & Cordes, J. M. 1993, ApJ, 411, 674 [Google Scholar]
- Thorne, B., Dunkley, J., Alonso, D., et al. 2019, arXiv e-prints [arXiv:1905.08888] [Google Scholar]
- Tucci, M., Martínez-González, E., Vielva, P., & Delabrouille, J. 2005, MNRAS, 360, 935 [Google Scholar]
- Van Eck, C. L., Gaensler, B. M., Hutschenreuter, S., et al. 2023, ApJS, 267, 28 [NASA ADS] [CrossRef] [Google Scholar]
- Weingartner, J. C., & Draine, B. T. 2001, ApJ, 548, 296 [Google Scholar]
- Yao, J. M., Manchester, R. N., & Wang, N. 2017, ApJ, 835, 29 [NASA ADS] [CrossRef] [Google Scholar]
- Zhang, J., Ghosh, S., Dou, J., et al. 2024, ApJS, 274, 26 [NASA ADS] [CrossRef] [Google Scholar]
The subscript 0 represents the quantity corresponding to a single electron.
DM mean std.fits downloaded from https://zenodo.org/records/10736552
LFI_CompMap_Foregrounds-commander-030_R3.00.fits, HFI_CompMap_Foregrounds-commander-100/353_R3.00.fits
We use COM_CompMap_Synchrotron-commander_0256 R2.00.fits map from Planck Collaboration X (2016) as the map of Stokes I. The map of Stokes Q and U are those from Delabrouille (2024), which combined WMAP and Planck low frequencies data, to obtain a low-noise full-sky map of synchrotron polarised emission.
COM_sCompMap_IQU-thermaldust-gnilc-varres_2048_R3.00.fits (Planck Collaboration IV 2020).
The sign of the imaginary part of permittivity depends on the Fourier transform convention. In this paper we adopted the following one:
 (13)
(13)
All Figures
|
Fig. 1 Sketch depicting the relative positions of the emission source, scatterer, and observer. The unit direction vectors pointing from the source to the scatterer, from the scatterer to the observer, and from the source to the observer are represented by n, n′, and n0 respectively. The distance between the source and the scatterer is denoted as r, while r′ corresponds to the distance between the scatterer and the observer. Additionally, |
| In the text | |
|
Fig. 2 Dispersion measure of Galactic electrons in logarithmic colour mapping, from Hutschenreuter et al. (2024). |
| In the text | |
|
Fig. 3 Scattered foreground radiation by Galactic free electrons. From top to bottom: Stokes parameters I, Q, U, intensities of the polarisation mode, and polarisation degrees, in unit of µKCMB , except that the dimension of polarisation degree is unit-less. From left to right: maps at 30 GHz, 100 GHz, and 353 GHz. The maps use logarithmic colour mapping for the temperature mode and linear colour mapping for the others. |
| In the text | |
|
Fig. 4 Angular power spectra |
| In the text | |
|
Fig. 5 Maps for Stokes parameters of the scattered foreground by dust particles, at 143 GHz. From top to bottom: Stokes I, Q, and U. |
| In the text | |
Current usage metrics show cumulative count of Article Views (full-text article views including HTML views, PDF and ePub downloads, according to the available data) and Abstracts Views on Vision4Press platform.
Data correspond to usage on the plateform after 2015. The current usage metrics is available 48-96 hours after online publication and is updated daily on week days.
Initial download of the metrics may take a while.