Fig. A.6
Download original image
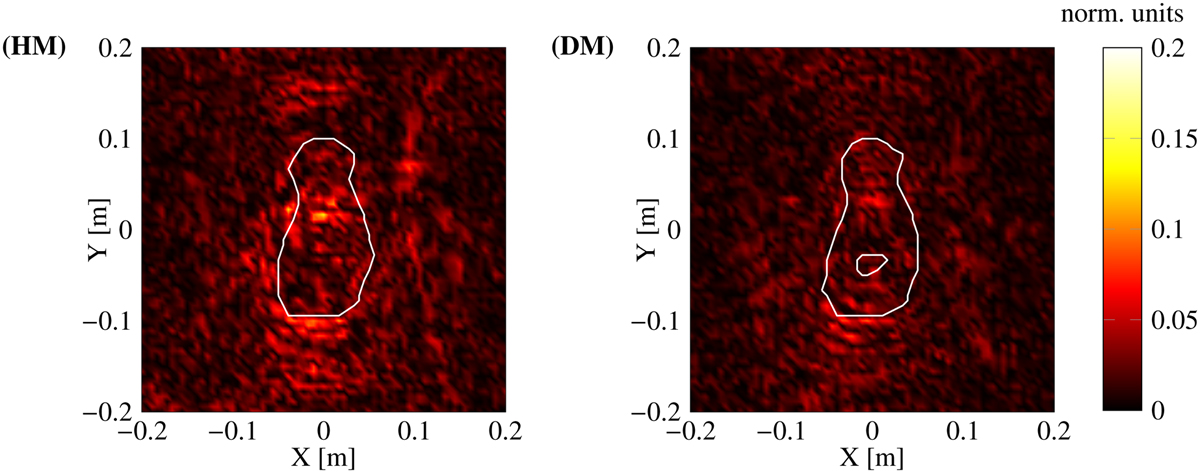
Slices of the difference between the amplitude of the induced current for the reconstruction considering the 3.5-12 GHz band with a step of 5Δf for 2372 quasi-monostatic positions (sixth row of Tables 2 and 3) and the reconstruction considering the 3.5-12 GHz band with a step of 5Δf for 1257 quasi-monostatic positions (Seventh row of Tables 2 and 3) for both analogues. The line plot corresponds to the theoretical analogue. The figures correspond to the plane Π1. The number of quasi-monostatic positions is the determining factor here.
Current usage metrics show cumulative count of Article Views (full-text article views including HTML views, PDF and ePub downloads, according to the available data) and Abstracts Views on Vision4Press platform.
Data correspond to usage on the plateform after 2015. The current usage metrics is available 48-96 hours after online publication and is updated daily on week days.
Initial download of the metrics may take a while.