Fig. 11
Download original image
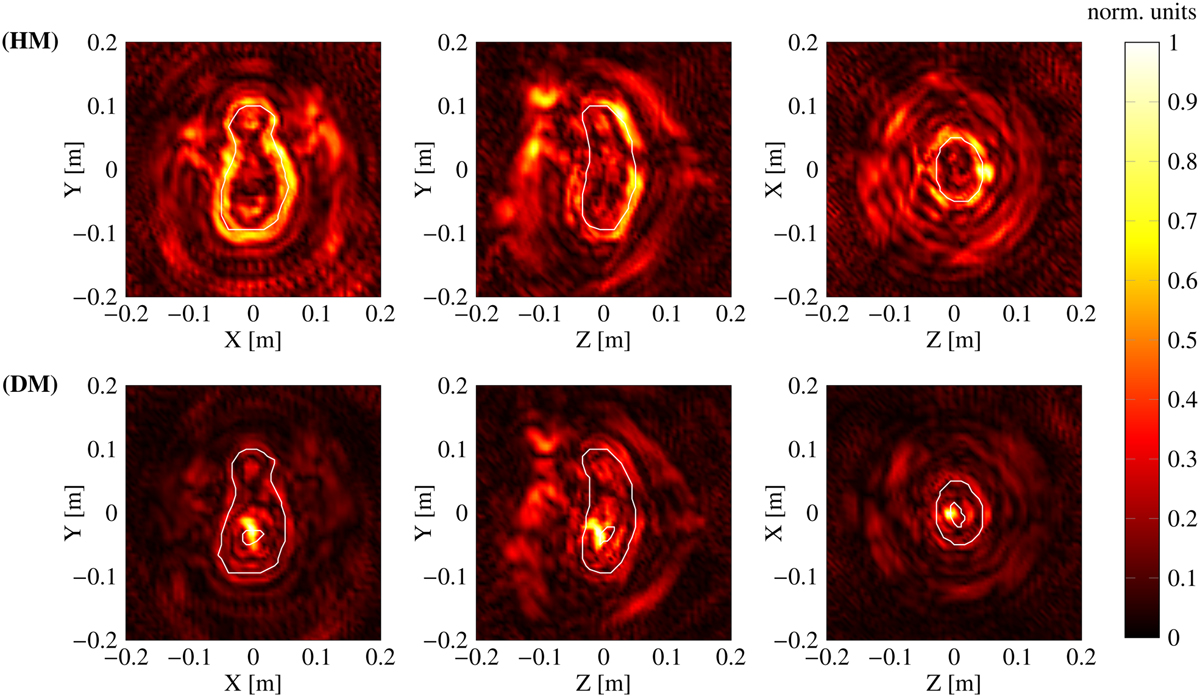
Slices of the amplitude of the reconstructed induced currents using the PI method for both analogues with 35 frequencies considering the 3.5–12 GHz range with a step of 5Δf. The line plot corresponds to the theoretical analogue. The figures on the left correspond to the plane Π1, those in the middle to the plane Π2, and those on the right to the plane Π3.
Current usage metrics show cumulative count of Article Views (full-text article views including HTML views, PDF and ePub downloads, according to the available data) and Abstracts Views on Vision4Press platform.
Data correspond to usage on the plateform after 2015. The current usage metrics is available 48-96 hours after online publication and is updated daily on week days.
Initial download of the metrics may take a while.