Fig. 9
Download original image
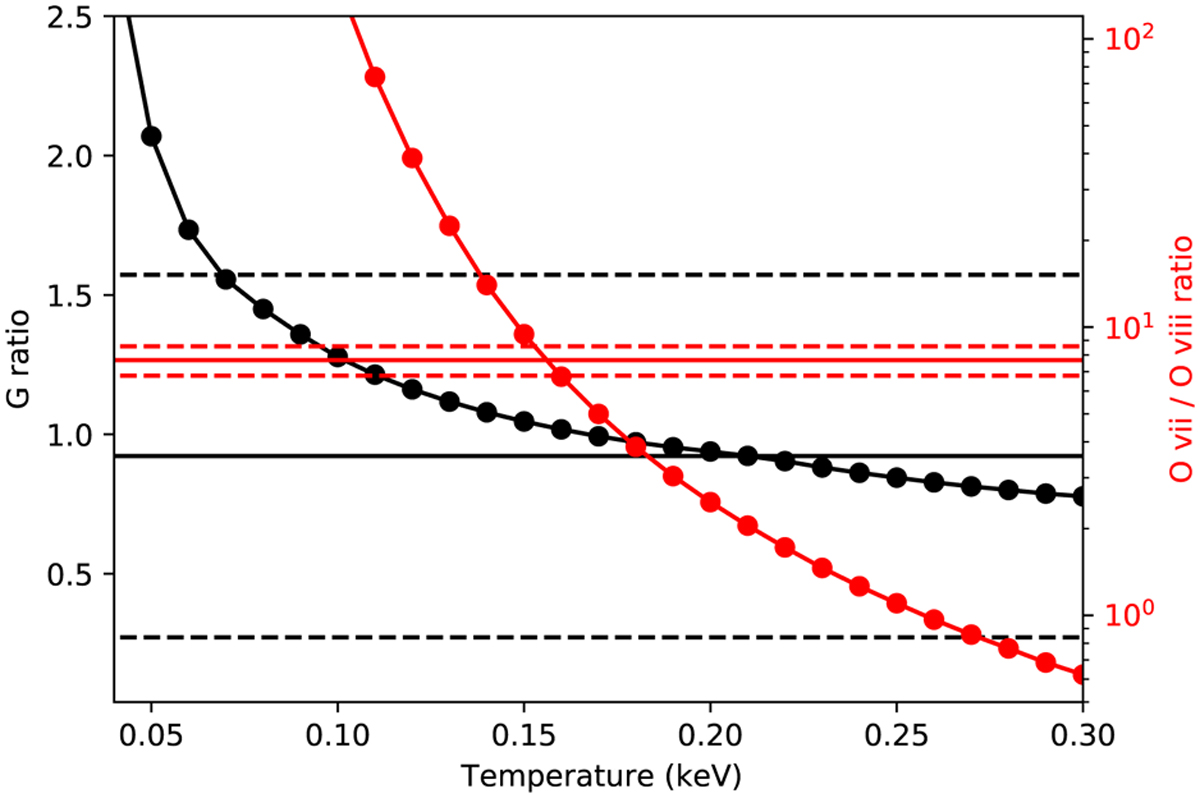
G-ratio (left) and Ο VII-to-O VIII emission line ratio (right) as a function of plasma temperature. The black solid and dashed horizontal lines show the best fit and 1σ uncertainty on the G-ratio measured by fitting the lines of the O VII triplet from the e12 spectrum. The black filled dots and connecting line show the expected relation between the G-ratio and temperature, expected for collisionally ionized plasma in thermal equilibrium (obtained from the APEC model in Xspec). The measurement of the G-ratio implies that the temperature must be kT > 0.06 keV, if produced by a single plasma component in thermal equilibrium. The red solid and dashed horizontal line shows the best fit and 1σ uncertainty on the Ο VIII-to-O VII line ratio measured by fitting the e12 spectrum. The red filled dots and connecting line show the expected relation between Ο VIII-to-O VII line ratio and temperature, expected for collisionally ionized plasma in thermal equilibrium (obtained from the APEC model in Xspec). Under the assumption that a single optically thin and collisionally ionized component is producing both lines, the observed line ratio implies that the temperature must be within the range 0.152 < kT < 0.160 keV. The two completely independent estimates of the temperature are in agreement with each other, suggesting that the same plasma might produce the bulk of the O VII and Ο VIII emission.
Current usage metrics show cumulative count of Article Views (full-text article views including HTML views, PDF and ePub downloads, according to the available data) and Abstracts Views on Vision4Press platform.
Data correspond to usage on the plateform after 2015. The current usage metrics is available 48-96 hours after online publication and is updated daily on week days.
Initial download of the metrics may take a while.