Fig. 5
Download original image
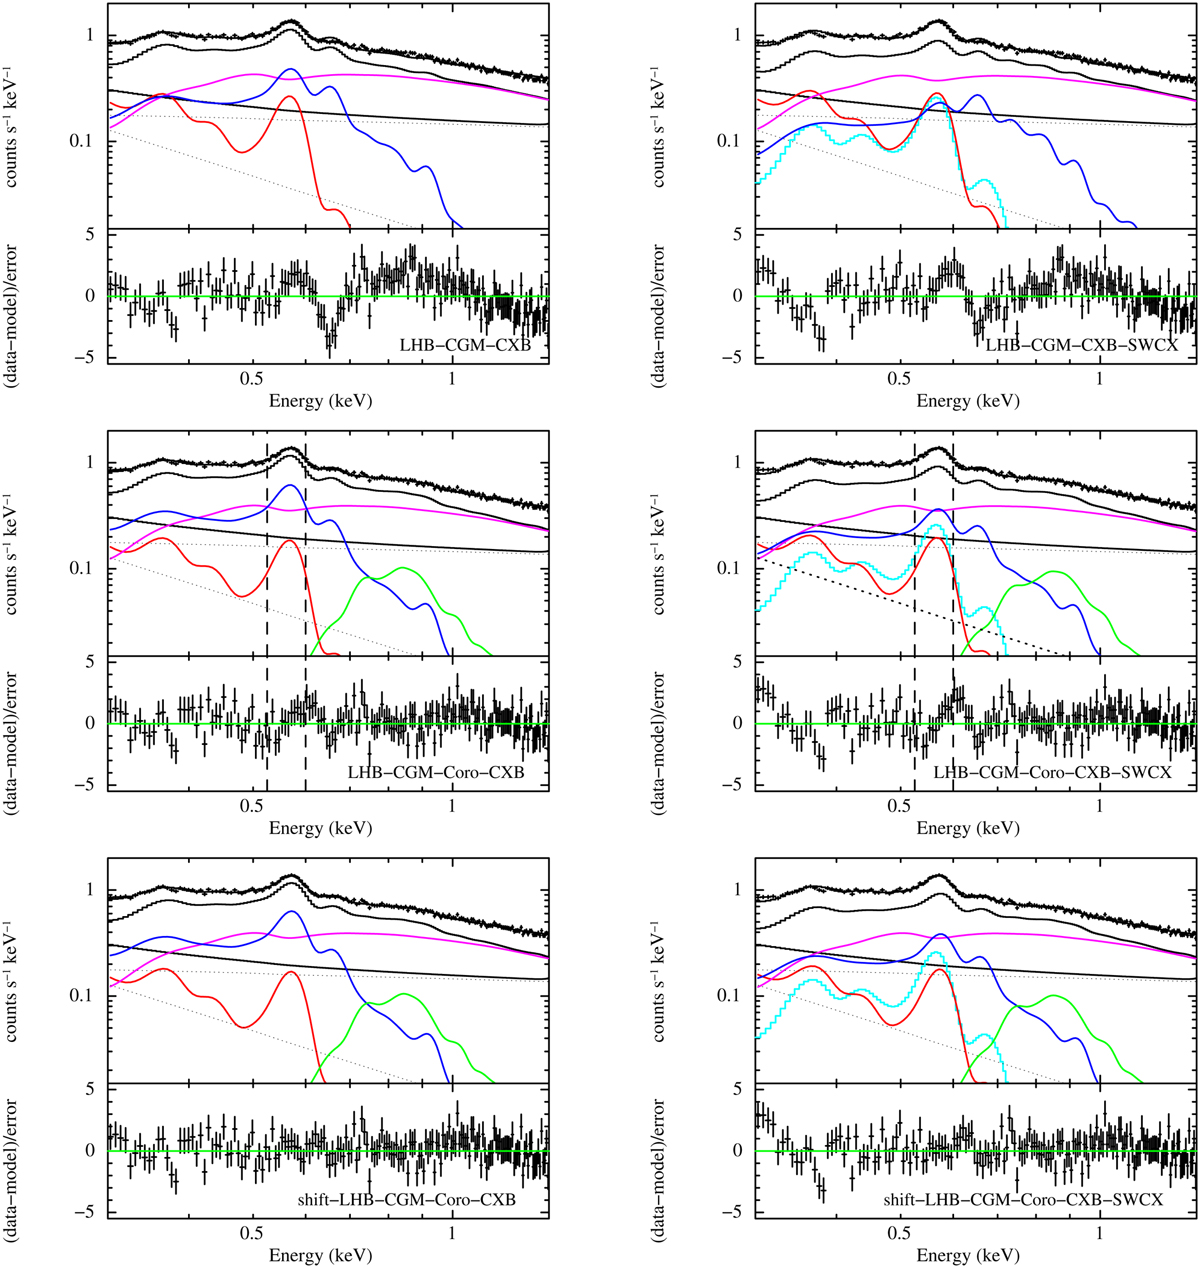
Top left panel: Diffuse emission as observed by eROSITA within the eFEDS field during e12, fitted with a three-component model (LHB-CGM-CXB in Table 2). The red, blue, magenta, and black solid lines show the contribution from the local hot bubble, circumgalactic medium, cosmic X-ray background, and instrumental background, respectively. The dotted lines show the various contributions to the instrumental background. Top right panel: Same as top left panel, once the contribution from SWCX is added to the model (LHB-CGM-CXB-SWCX). The cyan line shows the contribution due to SWCX. Central left panel: The addition of the emission from the Galactic corona (solid green) significantly improves the fit (LHB-CGM-Coro-CXB). However, significant positive residuals (at the position of the vertical dashed lines) remain at the energy of the blue wing of the very prominent O VII emission line as well as negative residuals on its red wing. Central right panel: Same as central left panel, with the addition of the SWCX component (LHB-CGM-CXB-Coro-SWCX model). Bottom left panel: The addition of a significantly different energy shift applied to the best fit model of each camera reduces the residuals around the O VII emission line (shift-LHB-CGM-Coro-CXB). Bottom right panel: Same as bottom left panel, with the addition of the SWCX component (shift-LHB-CGM-CXB-Coro-SWCX model).
Current usage metrics show cumulative count of Article Views (full-text article views including HTML views, PDF and ePub downloads, according to the available data) and Abstracts Views on Vision4Press platform.
Data correspond to usage on the plateform after 2015. The current usage metrics is available 48-96 hours after online publication and is updated daily on week days.
Initial download of the metrics may take a while.