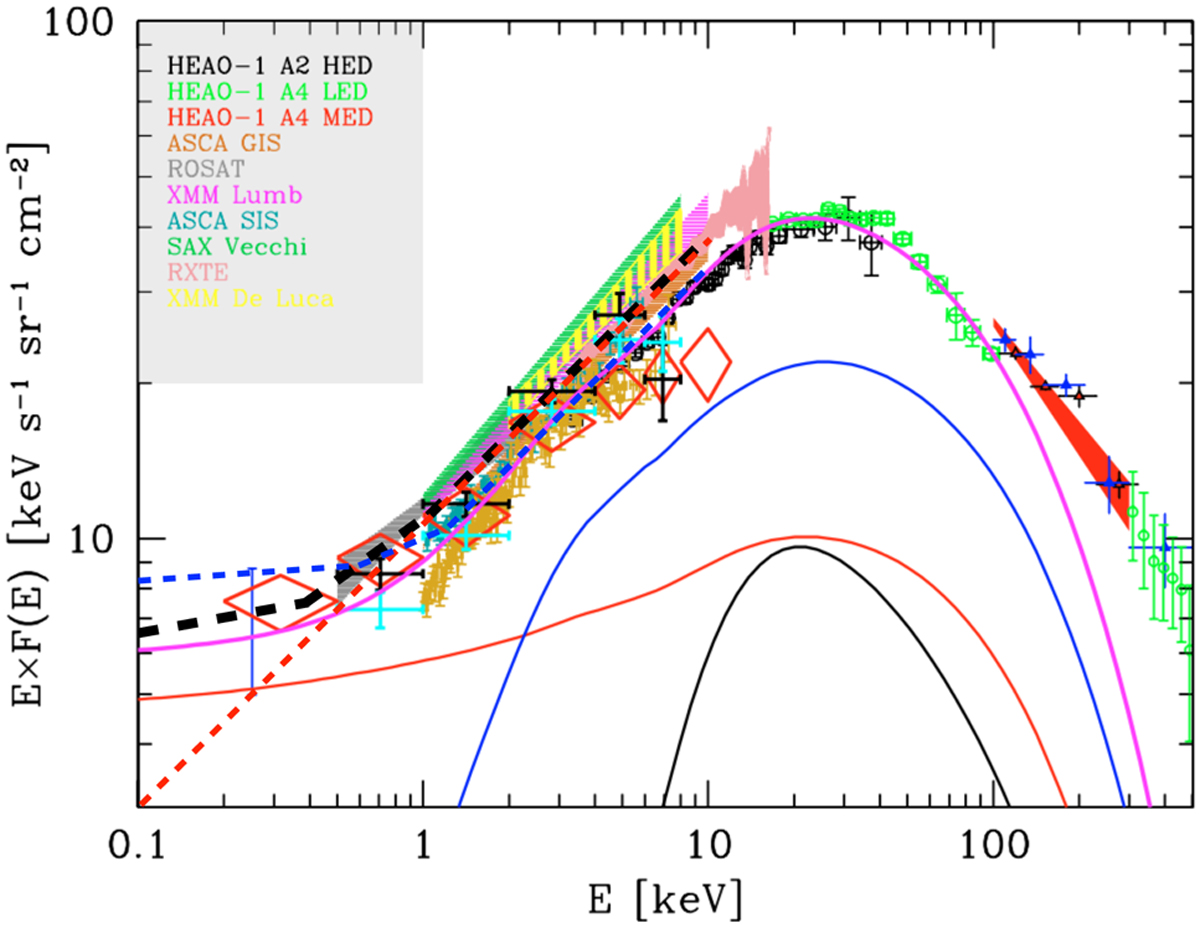
Fig. 4
Download original image
Cosmic X-ray background spectrum observed by different instruments (see legend at top left) (from Gilli et al. 2007). The solid lines show the predicted contribution from the different components. The black, blue, red, and magenta lines show the emission from Compton-thick, obscured Compton-thin, unobscured AGN, and total AGN plus galaxy cluster emission, respectively. The red dashed line shows the simplified CXB model often assumed in the literature, composed of a power-law shape with photon index Γ = 1.45 and normalization of 10.5 photons s−1 cm−2 sr−1 at 1 keV (referred to as CXBh in this work). In particular, this model fails to properly reproduce the data below ~1 keV. The black dashed line shows the double broken power-law model, defined in order to better reproduce the constraints on the cosmic X-ray background emission below ~1 keV (referred to as CXB in this work). It is composed of a power law with photon index of Γ1 = 1.9 below 0.4 keV, then Γ2 = 1.6 below 1.2 keV and then Γ3 = 1.45 above 1.2 keV, with a normalization of 8.2photons s−1 cm−2 sr−1 at 1 keV. The blue dashed line shows a double broken power law, chosen to maximize the cosmic X-ray emission from extragalactic sources, which is composed of a power law with photon index of Γ1 = 1.96 below 0.6 keV, then Γ2 = 1.75 below 1.2 keV, and then Γ3 = 1.45 above 1.2 keV, with a normalization of 8.5 photons s−1 cm−2 sr−1 at 1 keV (referred to as CXBs in this work).
Current usage metrics show cumulative count of Article Views (full-text article views including HTML views, PDF and ePub downloads, according to the available data) and Abstracts Views on Vision4Press platform.
Data correspond to usage on the plateform after 2015. The current usage metrics is available 48-96 hours after online publication and is updated daily on week days.
Initial download of the metrics may take a while.