Fig. 3
Download original image
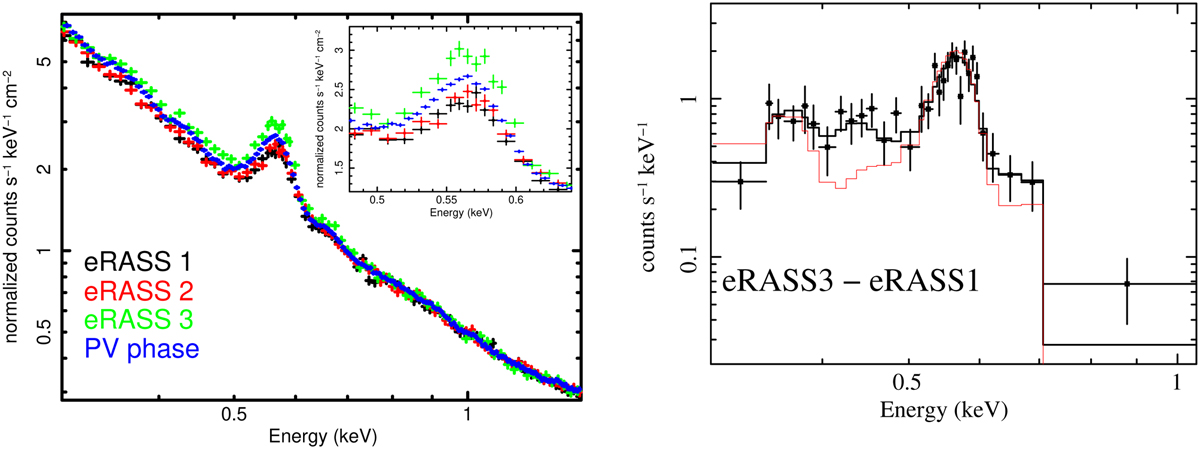
Left panel: Diffuse X-ray emission as observed by eROSITA in the eFEDS field during e1, e2, e3, and e0 (eRASS1, eRASS2, eRASS3, and PV phase observations) in black, red, green, and blue, respectively (the emission from different TMs is combined for display purposes). An enhancement at the energies of the soft X-ray emission lines is observed during e3, compared with e1 and e2. This enhancement is characterized by a spectral shape characteristic of the emission induced by SWCX. A similar enhancement is observed during e0. The inset shows an enlargement of the spectra around the O VII line where the enhancement is most evident. Right panel: Spectrum of the variable diffuse emission component fitted with a model for the SWCX. The black line shows the best fit model, while the red line shows a different implementation of the same model.
Current usage metrics show cumulative count of Article Views (full-text article views including HTML views, PDF and ePub downloads, according to the available data) and Abstracts Views on Vision4Press platform.
Data correspond to usage on the plateform after 2015. The current usage metrics is available 48-96 hours after online publication and is updated daily on week days.
Initial download of the metrics may take a while.