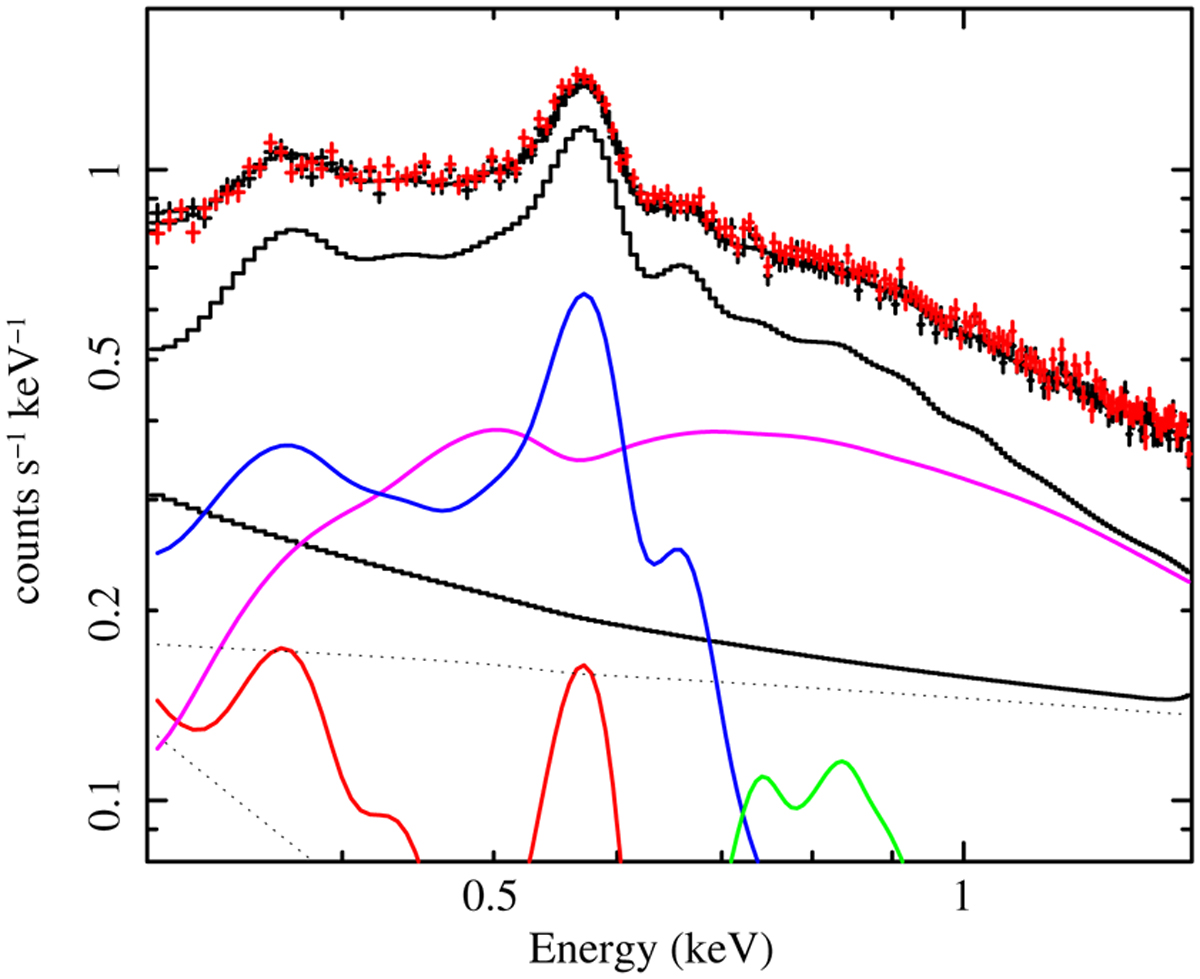
Fig. B.1
Download original image
The black data show the e12 spectrum fitted with the best fit model shift-LHB-CGM-Coro2-CXB (same spectrum and color scheme as in Fig. 5). The red data show the e12 spectrum obtained after filtering the events with the FLAREGTI tool. The two spectra are consistent with each other. Notable background flares are not detected during the observation of the eFEDS region during e1 and e2.
Current usage metrics show cumulative count of Article Views (full-text article views including HTML views, PDF and ePub downloads, according to the available data) and Abstracts Views on Vision4Press platform.
Data correspond to usage on the plateform after 2015. The current usage metrics is available 48-96 hours after online publication and is updated daily on week days.
Initial download of the metrics may take a while.