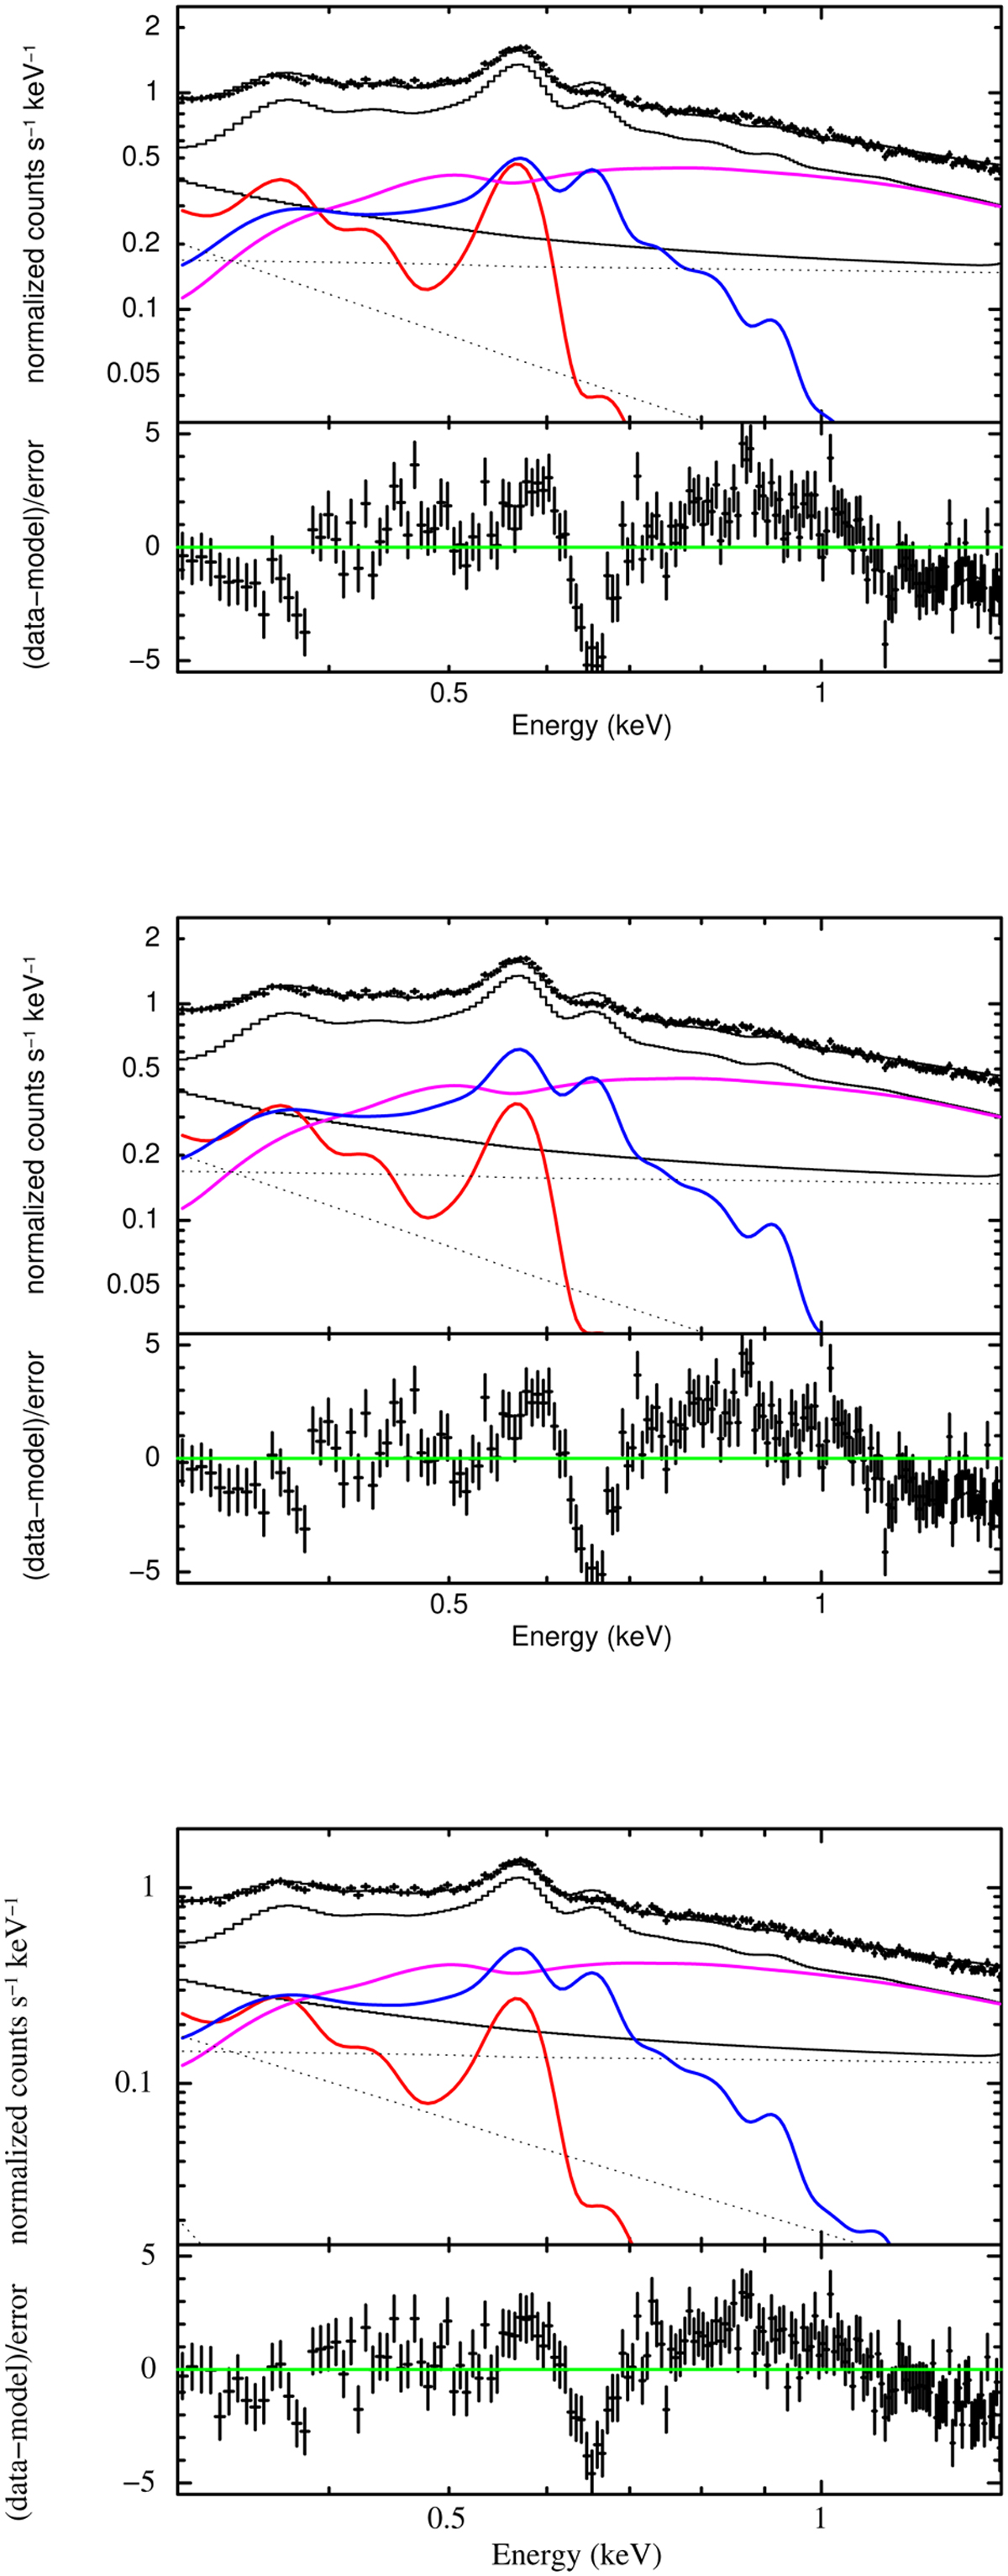
Fig. A.1
Download original image
Spectrum fitted with three-component models (LHB+CGM+CXB) assuming different metal abundances. The red, blue, magenta, and black solid lines show the contribution from the local hot bubble, the circumgalactic medium, the cosmic X-ray background, and instrumental background, respectively. The dotted lines show the various contributions to the instrumental background. From top to bottom: Anders & Grevesse (1989); Wilms et al. (2000), and Lodders (2003) abundances are assumed. Assuming the Anders & Grevesse (1989) abundances, about half of the O VII line flux is due to the local hot bubble, while for later abundances the contribution to the O VII line drops significantly. Large residuals are present at the energy of the O VIII line and between ~ 0.7 and 1 keV.
Current usage metrics show cumulative count of Article Views (full-text article views including HTML views, PDF and ePub downloads, according to the available data) and Abstracts Views on Vision4Press platform.
Data correspond to usage on the plateform after 2015. The current usage metrics is available 48-96 hours after online publication and is updated daily on week days.
Initial download of the metrics may take a while.