Fig. 10
Download original image
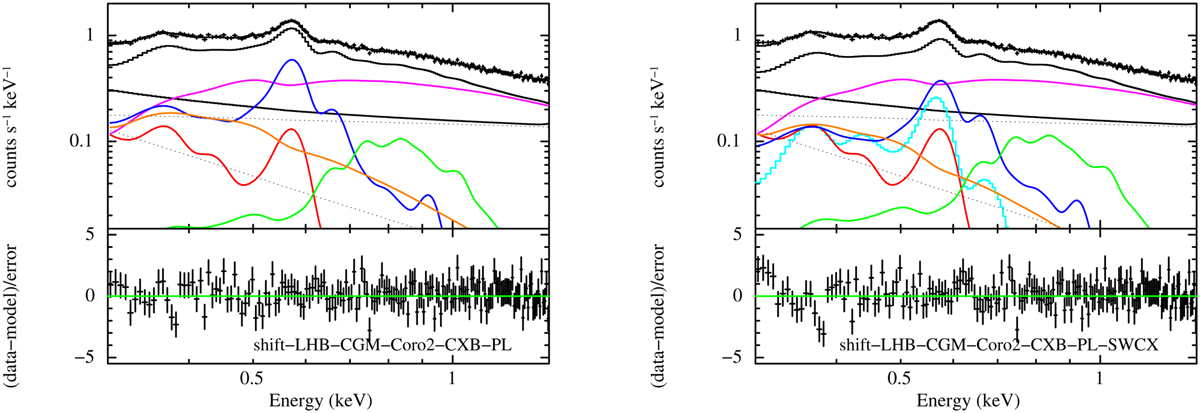
Same spectrum and color scheme as in Fig. 7. Left panel: Best fit model (shift-LHB-CGM-Coro2-CXB-PL in Table 3) after the inclusion of an additional non-thermal component (power law; shown with the orange solid line) to the same spectrum and model components shown in Fig. 7. Right panel: Same as left panel, but with the addition of the SWCX component (shift-LHB-CGM-Coro2-CXB-PL-SWCX model).
Current usage metrics show cumulative count of Article Views (full-text article views including HTML views, PDF and ePub downloads, according to the available data) and Abstracts Views on Vision4Press platform.
Data correspond to usage on the plateform after 2015. The current usage metrics is available 48-96 hours after online publication and is updated daily on week days.
Initial download of the metrics may take a while.