Fig. 5.
Download original image
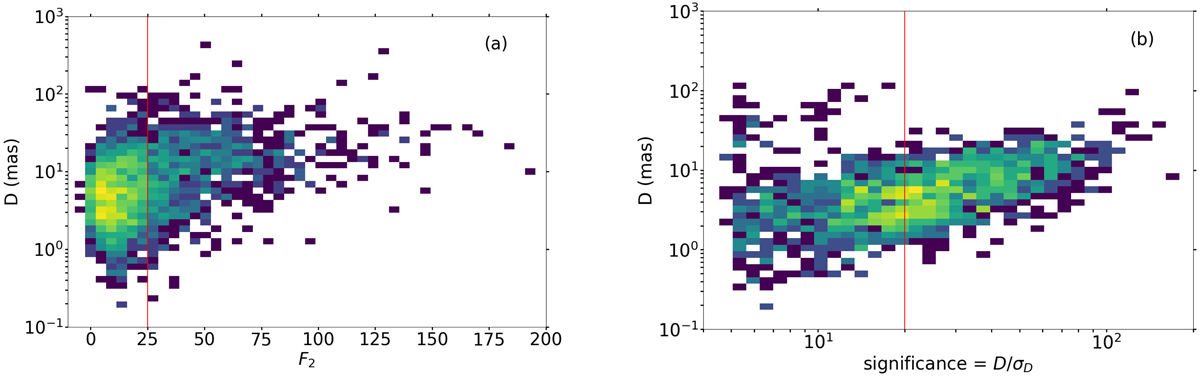
Post-processing filtering of the VIMF solutions. Panel (a): F2 vs. D diagram of the 2508 solutions obtained from the main processing. The proportion of large D, and therefore false solutions, increases gradually beyond F2 = 25, to the right of the vertical red line. Panel (b): significance vs. D diagram of the 1660 solutions with F2 < 25; acceptable solutions cluster on a sequence of D increasing with significance; abnormally large D solutions are rejected by restricting to significances greater than 20 (to the right of the vertical red line), leaving a final selection of 869 solutions.
Current usage metrics show cumulative count of Article Views (full-text article views including HTML views, PDF and ePub downloads, according to the available data) and Abstracts Views on Vision4Press platform.
Data correspond to usage on the plateform after 2015. The current usage metrics is available 48-96 hours after online publication and is updated daily on week days.
Initial download of the metrics may take a while.